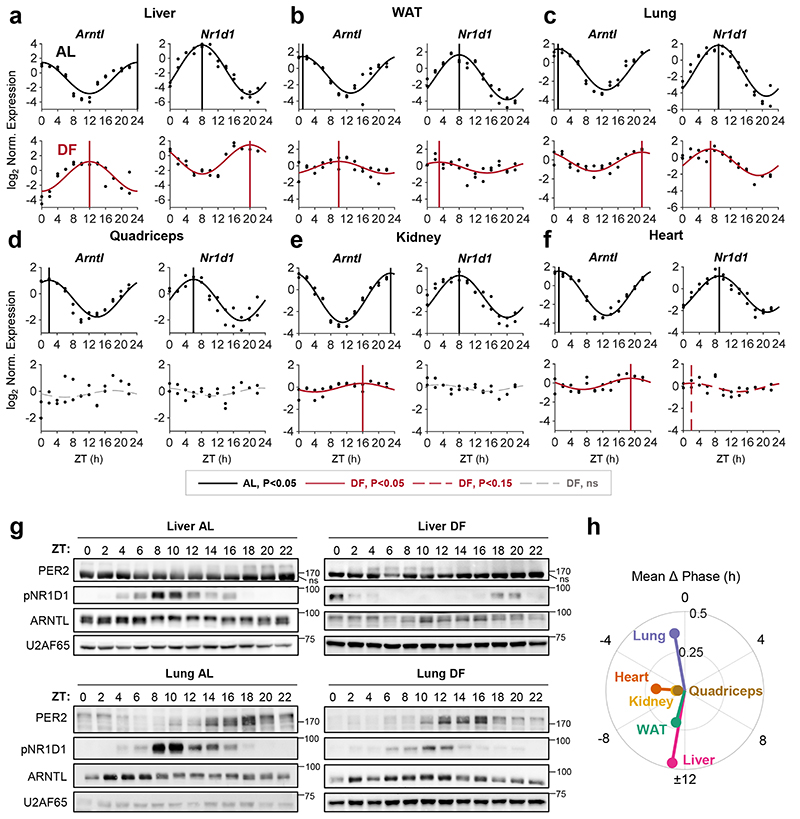
Figure 1. Feeding differentially affects clocks in peripheral tissues.
(a-f) Quantitative PCR results from mice (AlbCre) fed either ad libitum (AL) or exclusively during the light-phase (DF) for 30 days. Samples were collected at 2 h intervals for 24 h (n=2 biologically independent mice per time point). Presented are the clock genes Arntl (a.k.a Bmal1) and Nr1d1 (a.k.a. Rev-erbα) from the (a) Liver, (b) White Adipose Tissue (WAT), (c) Lung, (d) Quadriceps muscle, (e) Kidney, and (f) Heart. Dots mark individual measurements in each Zeitgeber Time (ZT). Significant rhythms according to JTK_CYCLE (P<0.05) are denoted by continuous cosine fit curve, with a vertical line representing the phase; dashed red curves represent rhythms with P<0.15; dashed gray curves represent non-significant (ns) rhythms. (g) Immunoblot analysis of core clock proteins from livers and lungs of mice fed either AL or DF. Presented are pooled samples of n=2 per time point. U2AF65 served as loading control (ns: non-specific band; size markers are given in kD). (h) Polar plot summary of the effects of DF on clock gene expression. Each vector represents the mean response of a single tissue. The vector’s angle represents the mean phase-shift in response to DF among all the rhythmic clock genes in the tissue. The vector’s length indicates the relative change in amplitude in response to DF (length of 1 represents no change in amplitude).

