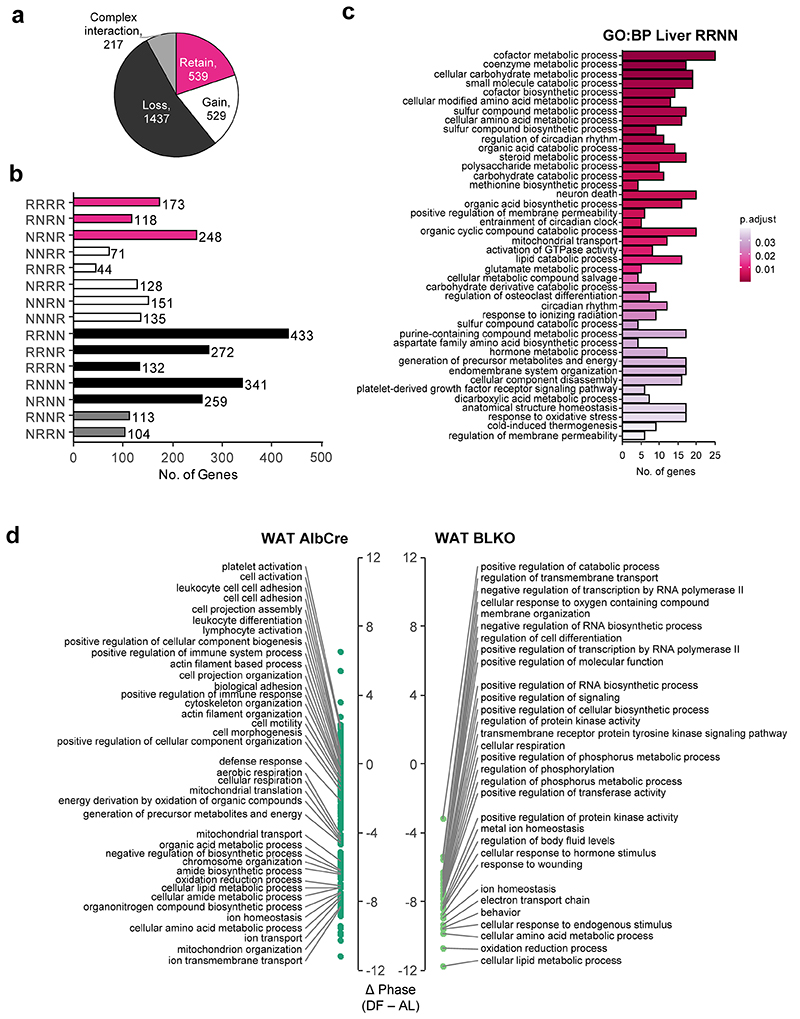
Extended Data Fig. 6. Impaired glucose homeostasis in liver-clock deficient mice in response to day feeding.
(a-c) Around-the-clock transcriptomic analysis of livers from either AlbCre control mice or liver-clock deficient mice (BLKO) fed either ad libitum (AL) or exclusively during the light-phase (DF) for 30 days. (a) Pie chart representing the distribution of genes between the different rhythmicity categories (see Fig. S4 for details). (b) Bar-plot representing the sizes of each rhythmicity subset (see Fig. S4 for details). (c) Gene Ontology (GO) Biological Processes (BP) enrichment analysis of rhythmic genes from the RRNN subset (P<0.05, over-representation test). (d) Phase Set Enrichment Analysis of GO terms in WAT of AlbCre (left panel) or BLKO (right panel) mice. Only terms that are significantly phase-enriched in both ad libitum (AL) and day fed animals (DF) are presented (P<0.05, Kuiper test), and the phase differences between the two regimens are depicted.

