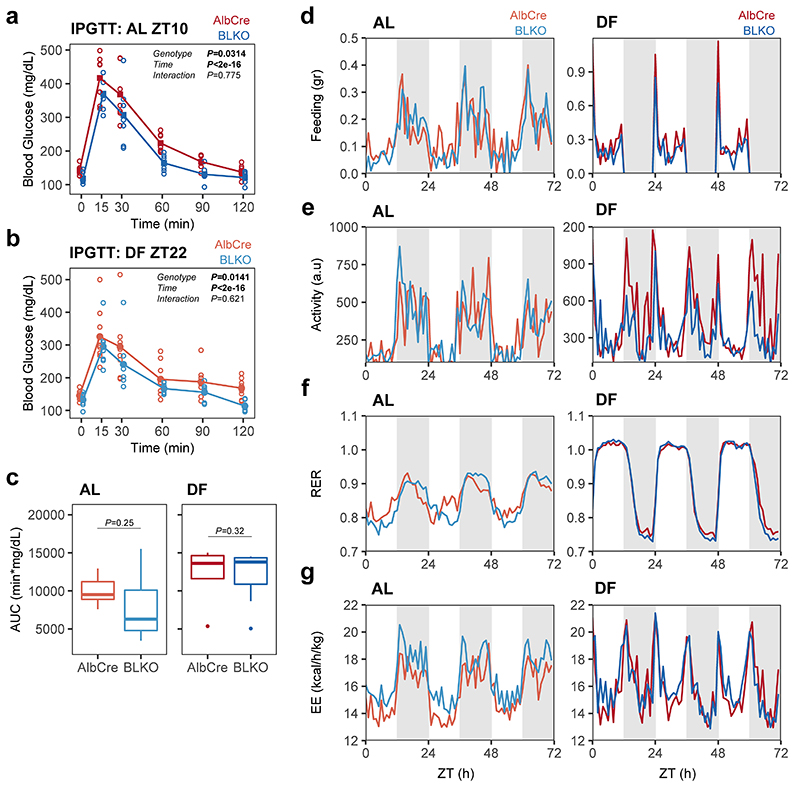
Extended Data Fig. 7. Behavioral and metabolic characterization of control and liver-clock deficient mice.
(a) Intra-Peritoneal Glucose Tolerance Test (IPGTT) analysis AlbCre or BLKO mice fed ad libitum (AL), performed at ZT10 after 2 h of food deprivation (Circles - individual mice, lines - mean levels; 2-way ANOVA with repeated measures design; AlbCre n=9 mice, BLKO n=8 mice). (b) IPGTT results from day-fed (DF) AlbCre or BLKO mice, performed at ZT22 (due to the daytime feeding, these mice were food deprived for 10 h), (Circles - individual mice, lines - mean levels; 2-way ANOVA with repeated measures design; n=7 mice per condition). (c) Area Under the glucose Curve (AUC), as calculated for the data in (a-b), (two-sided Student’s t-test, n as in (a) and (b); boxplots: middle line= median, box= 25th to 75th Inter Quantile Range (IQR), whiskers= the largest/smallest value no greater/smaller than 1.5*IQR, outlier points= measurements outside this range). (d-g) Mice fed either ad libitum (AL) or exclusively during the light-phase (DF) for 4 weeks and were analyzed in metabolic cages for three consecutive days under the same feeding regimens. (d) Food consumption, (e) Activity, (f) Respiratory Exchange Rate (RER), and (g) Energy expenditure (EE) are presented. The data is presented as average of individual mice (n=3 mice per genotype in AL, n=4 mice per genotype in DF), with 1 h binning of the data (original measurement were taken every 15 minutes).

