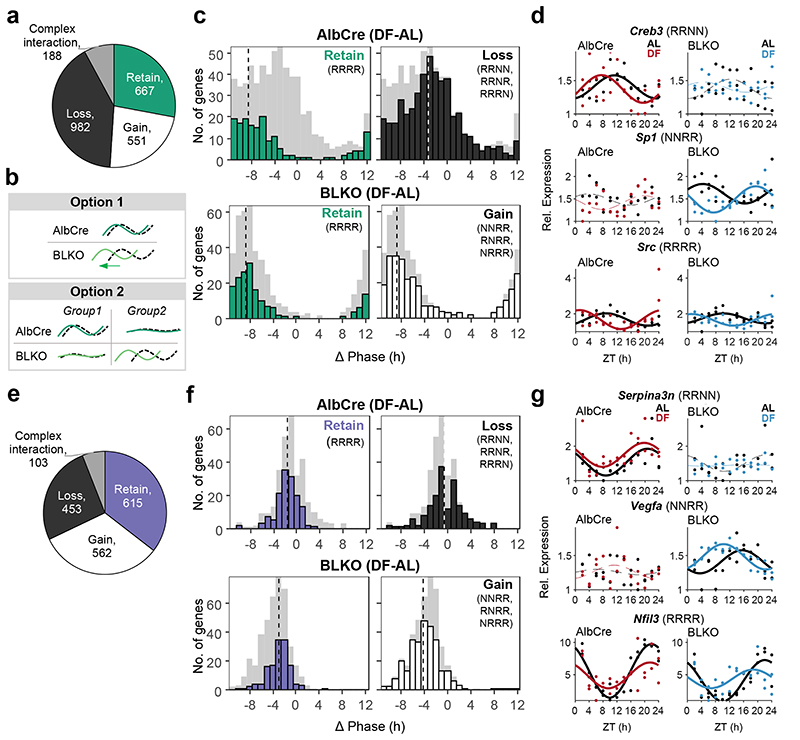
Figure 5. The liver-clock affects the composition of lung and WAT rhythmic transcriptome.
The rhythmic transcriptome was distributed into categories according to the gene’s behavior in each condition and genotype (see also Extended Data Fig. 4). (a) Pie chart representing the distribution of genes between the categories in WAT. (b) Schematic depiction of the two options that might account for the differences in phase distribution between the genotypes (see text for details). (c) WAT’s phase differences histograms for AlbCre (upper panels) and BLKO (lower panels), subdivided to the different categories (namely “Retain”, “Gain” and “Loss”). The dashed vertical lines signify the circular median phase-shift for each distribution. (d) RNA-seq expression profiles of representative genes for each category in WAT. Data is presented relative to the minimum of each panel. (Continuous cosine fit curve: Qmin <0.05, PHR<0.05 for the relevant condition; dashed curve: rhythmicity not significant; JTK_CYCLE and Harmonic Regression, see also Method section). (e) Pie chart representing the distribution of genes between the categories in lung. (f) Lung’s phase differences histograms for AlbCre (upper panels) and BLKO (lower panels), subdivided to the different categories (namely “Retain”, “Gain” and “Loss”). The dashed vertical lines signify the circular median phase-shift for each distribution. (g) RNA-seq expression profiles of representative genes for each category in lung. Data is presented relative to the minimum of each panel. (Continuous cosine fit curve: Qmin <0.05, P<0.05 for the relevant condition; dashed curve: rhythmicity not significant).

