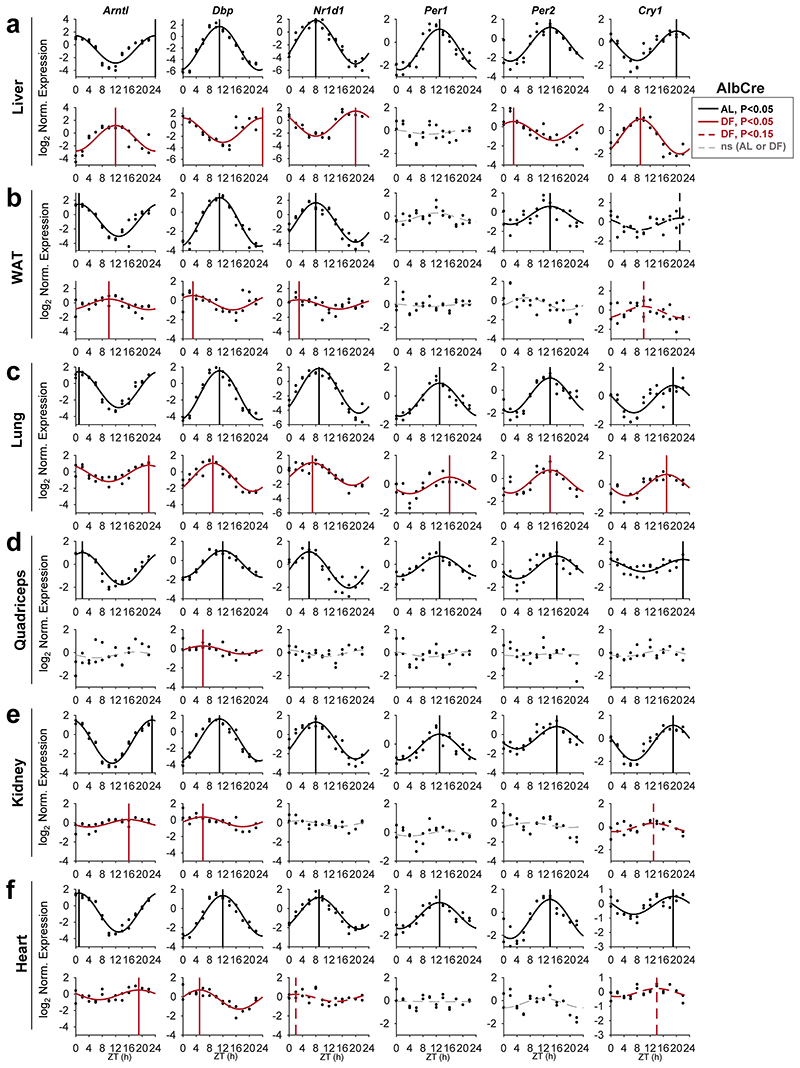
Extended Data Fig. 1. Feeding differentially affects clocks in peripheral tissues.
Quantitative PCR results from mice (AlbCre) fed either ad libitum (AL) or exclusively during the light-phase (DF) for 30 days. Samples were collected at 2 h intervals for 24 h (n=2 biologically independent mice per time point). Presented are representative clock genes from the (a) Liver, (b) White Adipose Tissue (WAT), (c) Lung, (d) Quadriceps muscle, (e) Kidney, and (f) Heart. Dots mark individual measurements in each Zeitgeber Time (ZT). Significant rhythms according to JTK_CYCLE are denoted by cosine fit curve according to the captions, with a vertical line representing the phase; dashed curves represent non-significant (ns) rhythms. Note that the profiles for Arntl and Nr1d1 are re-plotted from Fig. 1a-f and are included here as well to enable side-by-side comparison with other clock genes in each tissue.

