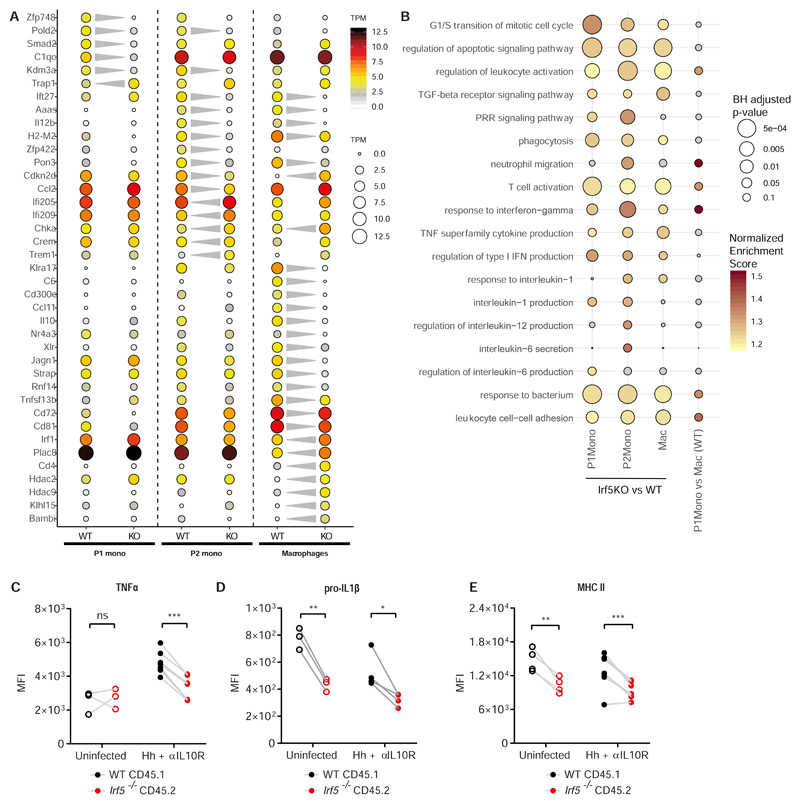
Figure 5. IRF5 defines an inflammatory MNP signature during colitis.
WT and Irf5-/- P1 monocytes, P2 monocytes and macrophages were sorted from three mixed bone marrow chimera animals at d21 Hh + αIL10R. A) The dot plot shows the expression (mean TPM, n=3 biological replicates) of selected genes found to be differentially expressed between WT and Irf5-/- cells at one or more stages of the monocyte waterfall. The significant changes (| fc | > 2, BH adjusted p < 0.05) are indicated by the grey triangles. B) Selected GO Biological process categories that showed a significant enrichment (coloured dots, GSEA analysis, BH adjusted p < 0.1) in at least one of the three Irf5 KO vs WT small bulk RNA-seq comparisons. C-E) Intracellular or extracellular flow cytometry labelling was used to quantify the expression of C) TNFα, D) pro-IL1β, E) MHC II on WT vs Irf5-/- macrophages in mixed bone marrow chimera uninfected (n=3), and at d21 Hh + αIL10R colitis (n=4). Two-Way ANOVA with Sidak Correction. Data from one representative experiment presented are mean ± SEM, ns = not significant, * p ≤ 0.05, ** p ≤ 0.01, *** p ≤ 0.001

