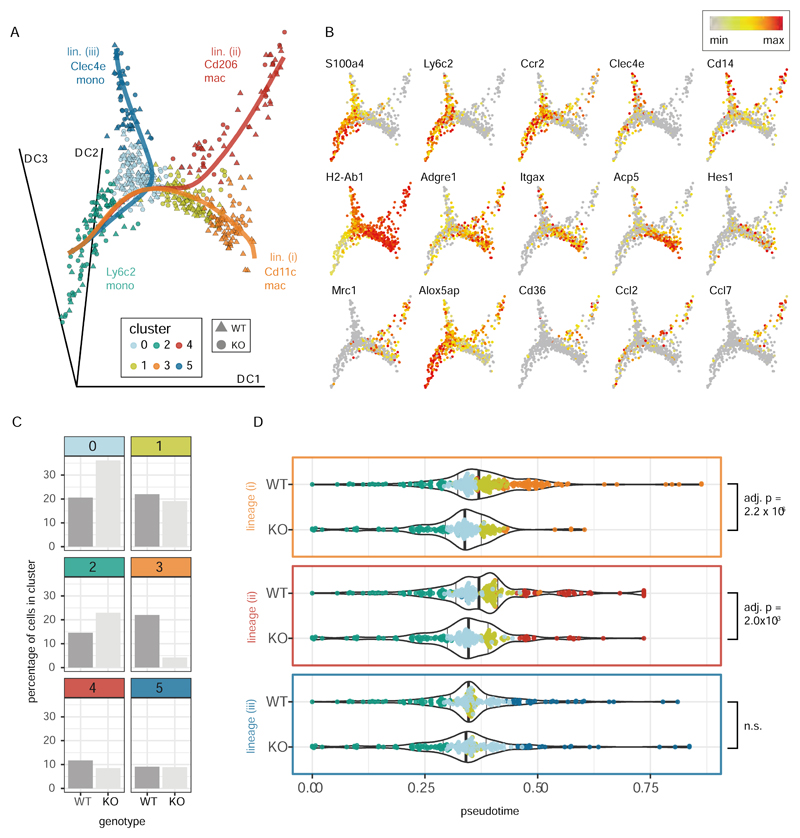
Figure 6. IRF5 promotes monocyte to Cd11c macrophage differentiation during intestinal inflammation.
WT and Irf5-/- monocytes and macrophages from the inflamed intestine (Fig 4) were re-clustered at higher resolution (Supplementary Fig S10) and subject to pseudotime analysis. A) Embedding of the cells in the first three dimensions of a diffusion map shows the three differentiation trajectories (solid lines) identified by the Slingshot pseudotime algorithm (with the Ly6c2 monocytes assumed to represent the root state) B) Expression of selected cell type marker genes and genes associated with Cd11c (Itgax) an Mrc1 (Cd206) macrophages. C) The bar plots show the percentages of WT and Irf5-/- cells that were found in each cluster. D) The violin plots show the progression of the WT and Irf5-/- (KO) cells through pseudotime along the three identified trajectories (as shown in A)). Differences in the distribution of cells in pseudotime between the genotypes were assessed with a KS tests (p-values adjusted using the Bonferroni correction). The position of the cells in pseudotime is shown on top of the violin plots (cells colored by cluster as in A)). The position of the 50th quantiles is indicated by the bold vertical lines.

