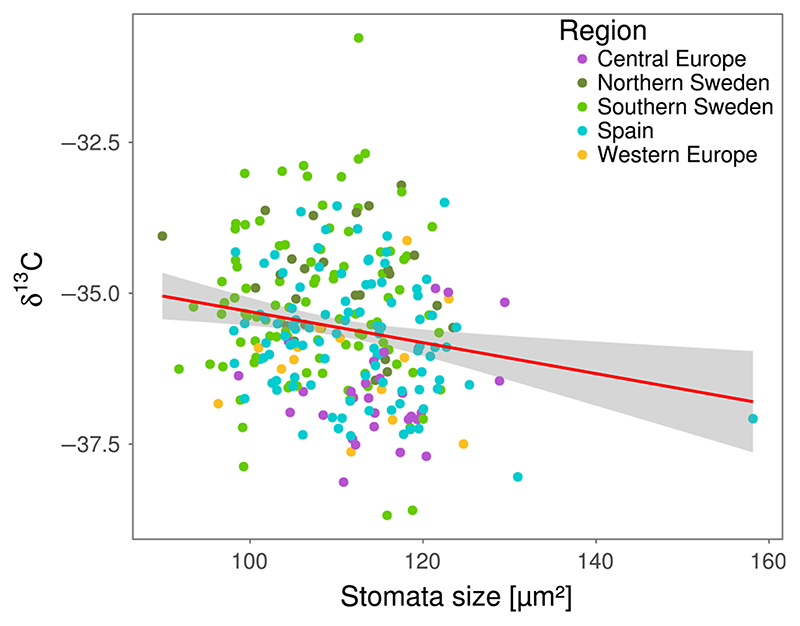
Figure 2.
Stomata size correlates with water-use efficiency. δ13C was measured for all plants in block 1. Plots show correlation of stomata size (block 1 only) with δ13C. δ13C is expressed as ‰ against the Vienna Pee Dee Belemnite (VPDB) standard. The red line shows a linear fit, and grey shadows indicate the error of the fit. Pearson’s product-moment correlation: r = -0.18, p = 0.004. Correlation of δ13C and stomata size is not only driven by the Spanish outlier (correlation without outlier: r = -0.16, p = 0.009). Genetic correlation was calculated using the MTMM approach: r = -0.58, p < 0.05

