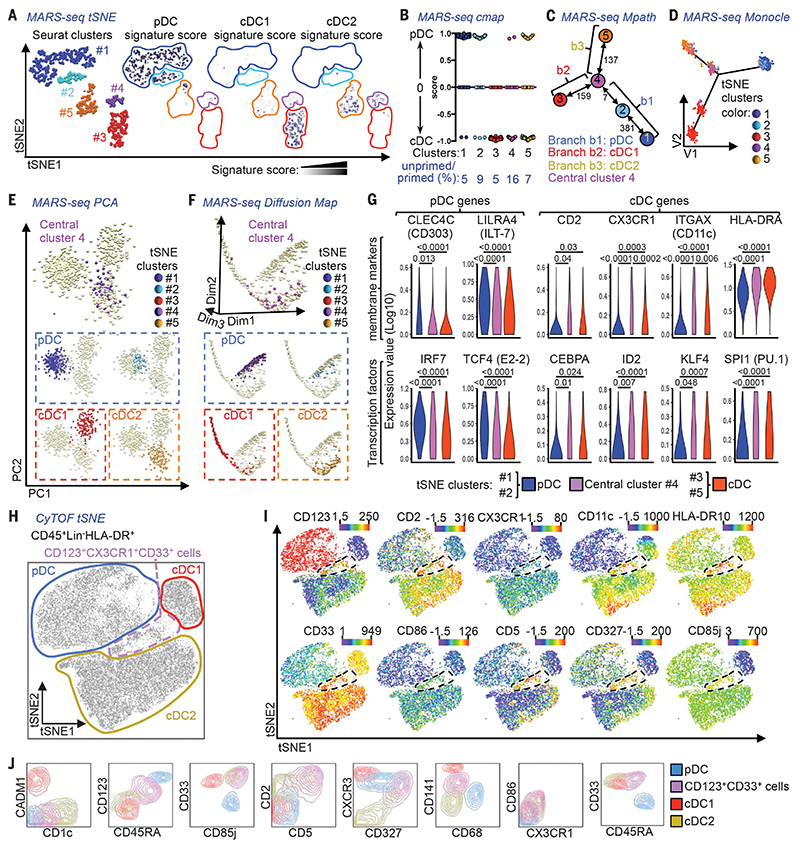
Fig. 2. Characterization of human pre-DC.
(A) Flow cytometric identification of pre-DC and pDC within PBMC and spleen cell suspensions. (B) Expression of CD303/CD304/CD123/CD11c by blood pre-DC and DC subsets. (C) % pre-DC within spleen (n = 3) and PBMC (n = 6) CD45+ populations. (D) Wright-Giemsa staining of sorted blood pre-DC and DC subsets. (E) Electron micrographs of pre-DC and pDC [RER (arrowheads), centriole (C), and microtubules (small arrows) near RER cisterna are indicated]. (F) DC subsets or pre-DC were cocultured for 5 days with MS-5 feeder cells, FLT3L, GM-CSF, and SCF. Their capacity to differentiate into cDC1 or cDC2 was measured by flow cytometry (n = 3). (G) Intracellular detection of cytokines in DC subsets and pre-DC post-TLR stimulation. TNF-α and IL-12p40 production by pDC and pre-DC, alongside mean % cytokine-positive pre-DC and DC subsets exposed to LPS, LPS+IFN-γ (L+I), polyI:C (pI:C), CL097 (CL), or CpG-ODN2216 (CpG) (n = 4). (H) Proliferation of naïve CD4+ Tcells cultured for 6 days with allogeneic pDC, total CD123+HLA-DR+ cells, or pre-DC (n = 2). (I) Frequency of pDC and pre-DC from control subjects (Ctrl) (n = 11) and Pitt-Hopkins syndrome (PHS) patients (n = 4). P values calculated by Mann-Whitney test. Error bars, mean ± SEM.

