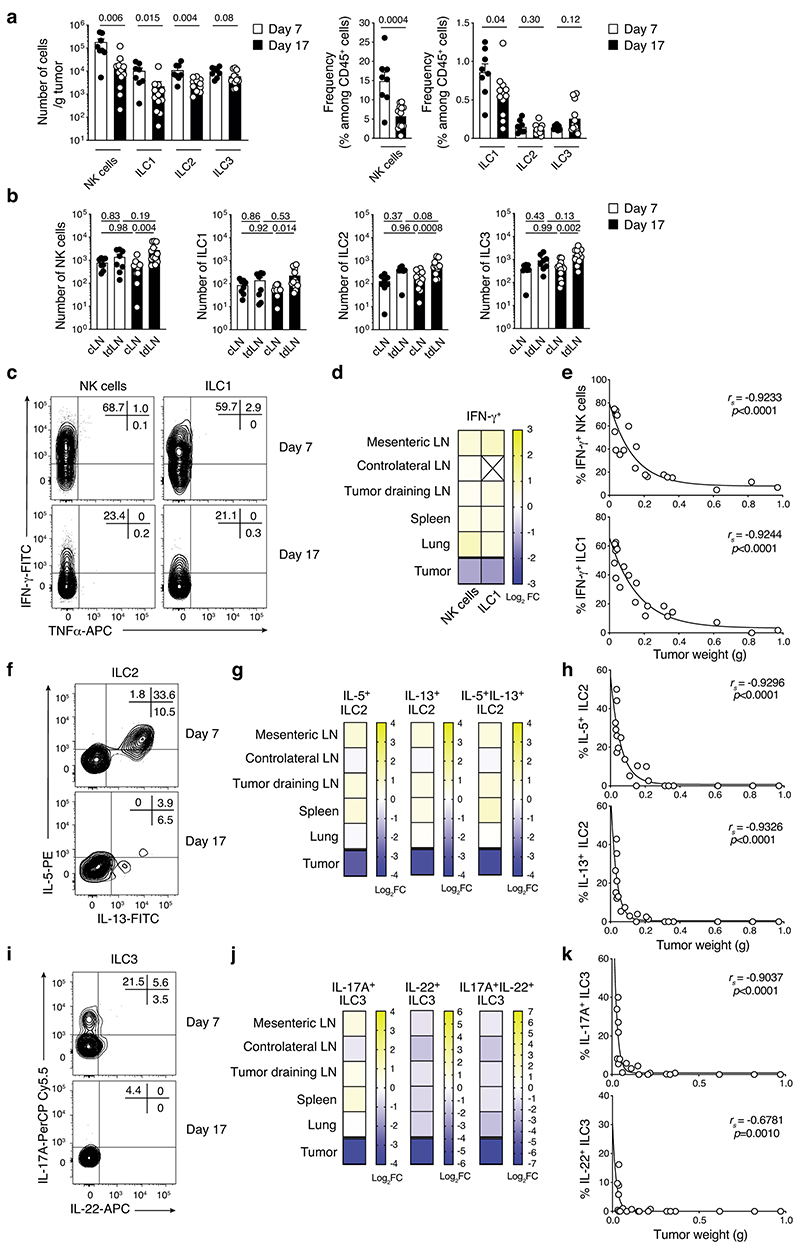
Extended Data Fig. 2. Flow cytometric analyses of innate lymphoid cell subsets in Ret melanoma tumor-bearing mice.
a,b, Enumeration (a and b) and frequency (a) of NK cells, ILC1, ILC2 and ILC3 in tumors (a) and control and tumor-draining lymph nodes (b) at 7 and 17 days after Ret tumor cell inoculation of C57BL/6J mice. NK cells were CD45+CD3-TCRβ-CD19-(lin-)CD11b+/-NK1.1+NKp46+EOMES+CD49a-, ILC1 lin-CD11b+/-NK1.1+NKp46+EOMES-CD49a+; ILC2 lin-CD11b+/-NK1.1-NKp46-RORγt-GATA3+; ILC3 lin-CD11b+/-NK1.1-NKp46-RORγt+ GATA3- cells. Data pooled from 2 independent experiments with 4-6 mice/experiment/time-point (day 7, n=8 mice; day 17, n=12 mice). c-k, Intracellular cytokine production in in vitro stimulated ILC subsets from tumors in C57BL/6J mice at day 7 and 17 for IFN-g and TNF-a (c), IL-5 and IL-13 (f), and IL-17A and IL-22 (i) in NK cells and ILC1 (c), ILC2 (f) and ILC3 (i). Representative samples for each time point (n=4-6 mice/experiment). d,g and j, Heatmaps showing the log2 fold change between day 7 and 17 of the mean intracellular IFN-g (d), IL-5 and IL-13 (g), and IL-17A and IL-22 (j) in NK cells and ILC1 (d), ILC2 (g) and ILC3 (j) from different tissues. Data are pooled from 2 experiments (day 7, n=8 mice, except for the lung, n=4; day 17, n=12 mice; 4-6 mice per experiment/time point). Insufficient ILC1 were recovered from the contralateral lymph nodes for accurate data interpretation (indicated by a cross). e,h and k, Frequency of tumor-infiltrating IFN-g+ NK cells and ILC1 (e), IL-5+ and IL-13+ ILC2 (h), and IL-17A+ and IL-22+ ILC3 (k) relative to tumor weight (g). Data shows pooled results from day 7 (n=8) and 17 (n=12). a,b,e,h, and k, Each dot represents one mouse. a and b, Data show the mean ± s.e.m and statistical analyses were performed using unpaired Student’s t tests (a) or ANOVA followed with Tukey’s multiple comparison tests (b). e,h, and k, Correlations were assessed using non-parametric Spearman’s correlation test. Non-linear fitting curves (one-phase decay) were overlaid. Spearman’s Rho (rs) and p-values are indicated.

