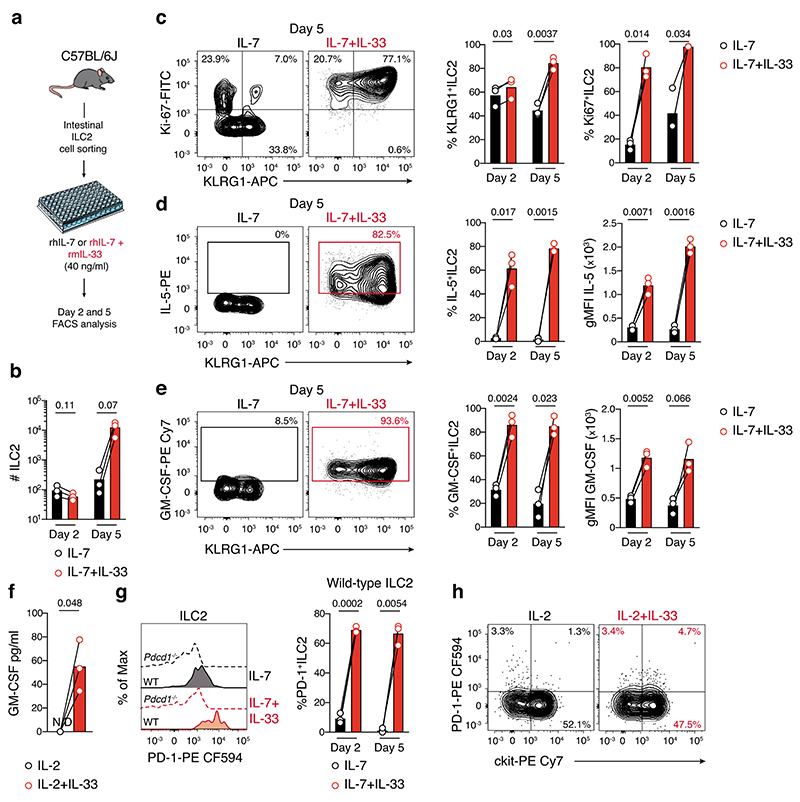
Extended Data Fig. 10. IL-33 stimulation induces expansion and proliferation of KLRG1+ ILC2 associated with increased cytokines production and PD-1 expression.
a-f, Flow cytometric analyses of the impact of IL-33 stimulation on purified intestinal ILC2. Live ILC2 were identified as follow: CD45+CD3-CD19-TCRβ-CD11b-NK1.1-c-kit-Sca-1+KLRG1+/-. a, Experimental design. Purified intestinal ILC2 were cultured for 2 and 5 days in complete media supplemented with rIL-7 or rIL-7+rIL-33 (all 40 ng/ml) before flow cytometric analyses. b, ILC2 enumeration. c-e, Representative flow-cytometric contour plots (c, d and e, left panels) and frequencies or geometrical mean fluorescent intensities of KLRG1 (c, middle panel), Ki-67 (c, right), IL-5 (d) and GM-CSF (e). c-e Data show one of two experiments showing individual responses (open circles) and the mean of three biological replicates. Flow cytometric contour plots depict a representative analysis performed at day 5 of culture. f, GM-CSF concentration in culture supernatant of purified human ILC2 isolated from the blood of three healthy donors and stimulated with rIL-2 (5 ng/ml) or rIL-2+rIL-33 (5 ng/ml and 10 ng/ml, respectively). ILC2 were identified as Live+CD45+lin-(TCRαβ-TCRγδ-CD14-CD3-CD19-CD34-FcεRI-CD123-CD303-CD15-CD33-CD11c-CD56-CD16-) CD127+ CRTH2+. Data show the mean GM-CSF production of 3 healthy donors pooled from two independent experiments. N.D., not detected. g, Histograms (left panel) and frequencies (right panel) of PD-1 expression on wild-type and Pdcd1-/- ILC2 (2.5 × 10³ cells/well) cultured in vitro for 2 and 5 days in complete media supplemented with rIL-7 or rIL-7+rIL-33 (all 40 ng/ml). Data show the mean of three biological replicates. h, Representative flow-cytometric contour plots showing PD-1 expression on purified human ILC2 isolated from blood of healthy donors after two days of stimulation with rIL-2 (5 ng/ml) or rIL-2+rIL-33 (5 ng/ml and 10 ng/ml, respectively). ILC2 were identified as in f. One representative healthy donor out of two yielding similar results is shown. b-f, Statistical analyses were performed using paired Student’s t-test. p-values are indicated.

