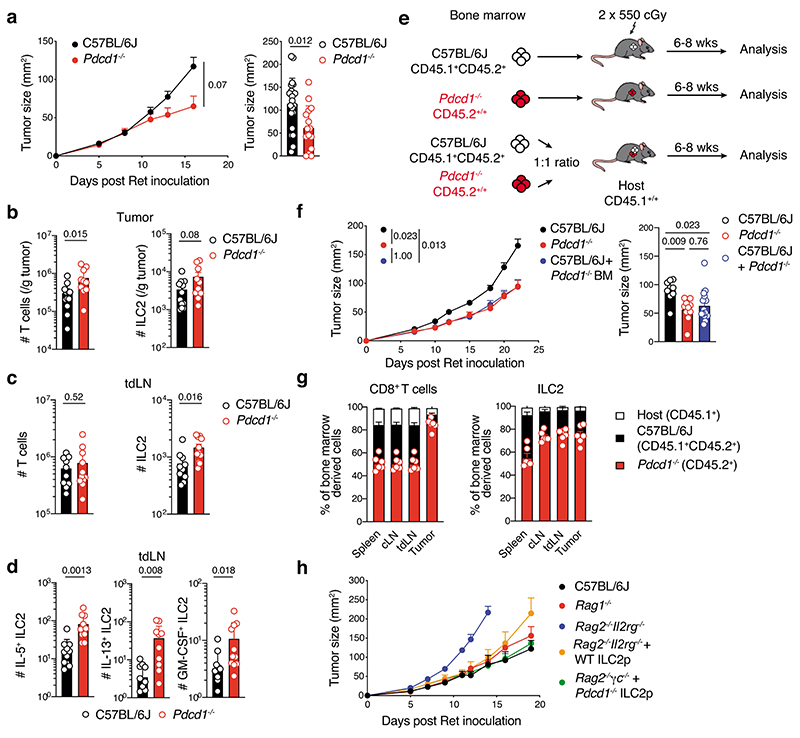
Fig. 7. PD-1 expression inhibits tumor ILC2 infiltration and ILC2-dependent anti-tumor functions.
a, Cumulative tumor growth (left panel) and tumor size (day 15-16, right panel) in C57BL/6J and Pdcd1–/– mice inoculated intradermally with Ret tumor cells. Data pooled from three independent experiments (C57BL/6J, n=26 mice; Pdcd1–/–, n=20 mice) with 6-11 mice per experiment/group. b-d, Enumeration of T cells (CD45+CD3+TCRb+), ILC2 (CD45+CD3-TCRb-NK1.1-CD11b-RORγt-GATA3+, b and c) and ILC2-cytokine producing cells (d) in tumors (b) and tumor draining lymph nodes (tdLN) (c and d) from C57BL/6J and Pdcd1–/– mice at day 7 following 4hr in vitro stimulation. Data pooled from 2 independent experiments (n=12-10 mice/genotype) with 5-6 mice per experiment/genotype. e-g, C57BL/6J (Ly5.1+Ly5.2+) → Ly5.1, Pdcd1–/– (Ly5.2+) → Ly5.1 or mixed (ratio 1:1) of C57BL/6J:Pdcd1–/– → Ly5.1 bone marrow chimeras were injected with Ret tumor cells 6 weeks after reconstitution. e, Experimental design. f, Tumor growth (left) and tumor size (day 18, right). Data pooled from 2-3 independent experiments (C57BL/6J, n=9 mice; Pdcd1–/–, n=10; C57BL/6J:Pdcd1–/–, n=15) with 3-6 mice/group/experiment. g, Frequency of CD8+ T cells (left) and ILC2 among bone marrow-derived cells in the spleen, LN and tumor. Data show one experiment (n=6 mice). h, Ret tumor growth in C57BL/6J, Rag1–/– mice and Rag2–/–Il2rg–/– mice, or Rag2–/–Il2rg–/– mice reconstituted with wildtype (WT) or Pdcd1–/– purified bone marrow-derived ILC2p six weeks prior to injection. Data show one experiment (C57BL/6J, n=6 mice ; Rag1–/–, n=6 mice; Ragc–/–Il2rg–/–, n=3 mice; Rag2–/–Il2r–/– + wildtype ILC2p, n=5 mice; Rag2–/–Il2rg–/– + Pdcd1–/– ILC2p, n=5 mice). (a-d, f and g) Each circle represents one mouse. (a-d,f-h) Data show mean ± s.e.m. (b-d) Statistical analyses were performed using unpaired Student’s t-test. (a and f) Tumor growth statistical analyses were performed using TumGrowth. p-values are indicated.

