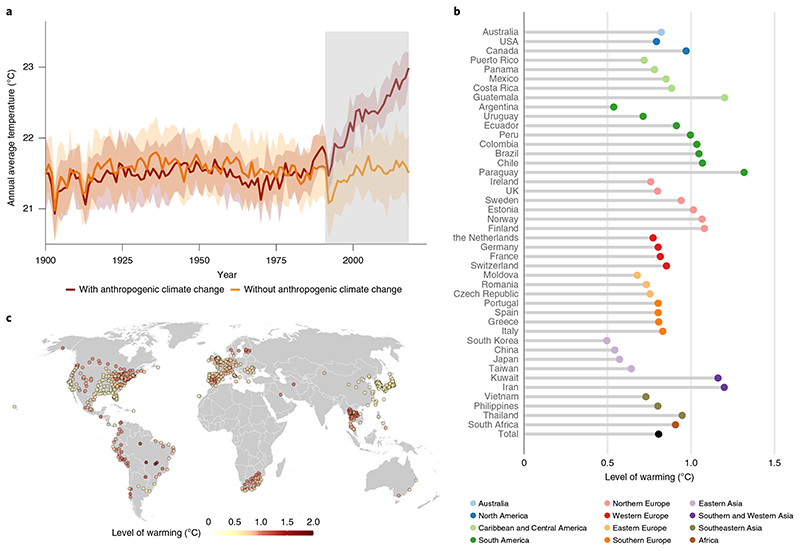
Fig. 1. Temperature modelled under the factual (with both anthropogenic and natural forcings) and counterfactual (with only natural forcings) scenarios.
a, Warm-season average temperature since 1900, including the 1991–2018 study period (shaded) across the 732 locations. b, Temperature differences between scenarios in the 43 study countries, respectively, during the study period (warm season only). Country results are based on included locations only. c, Average temperature difference between scenarios during the study period in the 732 study locations (warm season only).

