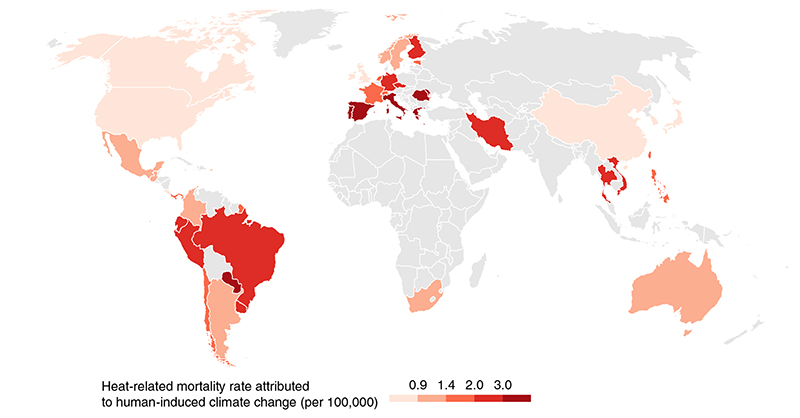
Fig. 5. Heat-related mortality rate attributable to human-induced climate change, 1991–2018.
The estimated rate in each country is based on the attributable fractions for the location(s) within the country. The rates indicate the total burden in the population and are thus a complementary measure of impact to that of Fig. 4b, which reports the attributable fraction. For example, the rate shown here for Brazil is relatively modest, whereas the fraction is high; the opposite is true in a country like Greece.

