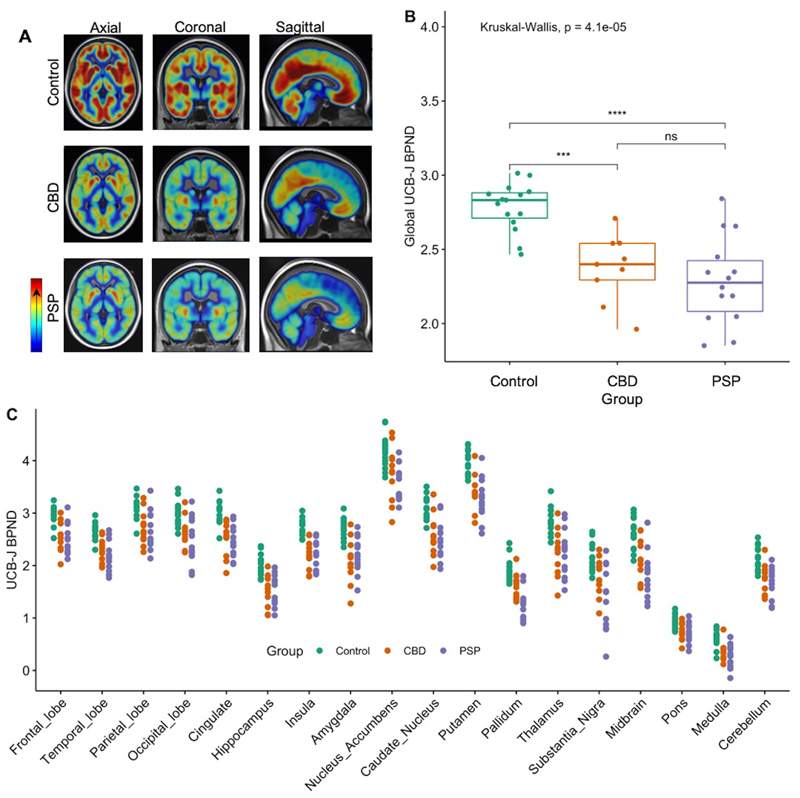
Figure 1.
(A) Mean [11C]UCB-J BPND maps for control participants (top row), CBD (middle row), and PSP (bottom row); high and low BPND values are shown by red and blue areas, respectively.
(B) Reduction in global [11C]UCB-J BPND across patients compared to controls (P<0.05).
(C) Individual regional GTM PVC [11C]UCB-J BPND values for control, CBD and PSP participants, across major regions of interests. Binding potential values for patients differed significantly from controls in all the regions depicted (P<0.05, FDR corrected).

