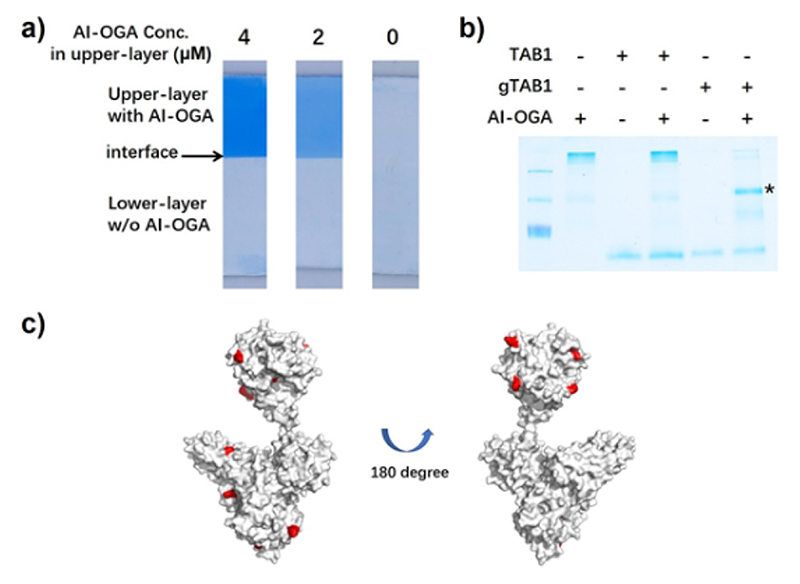
Fig. 2. Characterization of AI-OGA.
a) Two-layer gels with AI-OGA added to the upper-layer at indicated concentration. The clear interface between two layers was indicated with arrow. b) AI-OGA/gTAB1 complex revealed by gel-shift assay. Briefly, 10 pmol AI-OGA was mixed with 15 pmol of TAB1 or gTAB1. The mixture was subjected to native-PAGE and the stable complex was indicated with asterisk. c) Acrylamide modified lysine residues on AI-OGA. The AI-OGA structure was modelled with PHYRE2 software using PDB 2CBJ and 4AKG as templates. 11 modified lysine with a Delta score > 40 were labelled in red. 6 of these sites located in the GST region.

