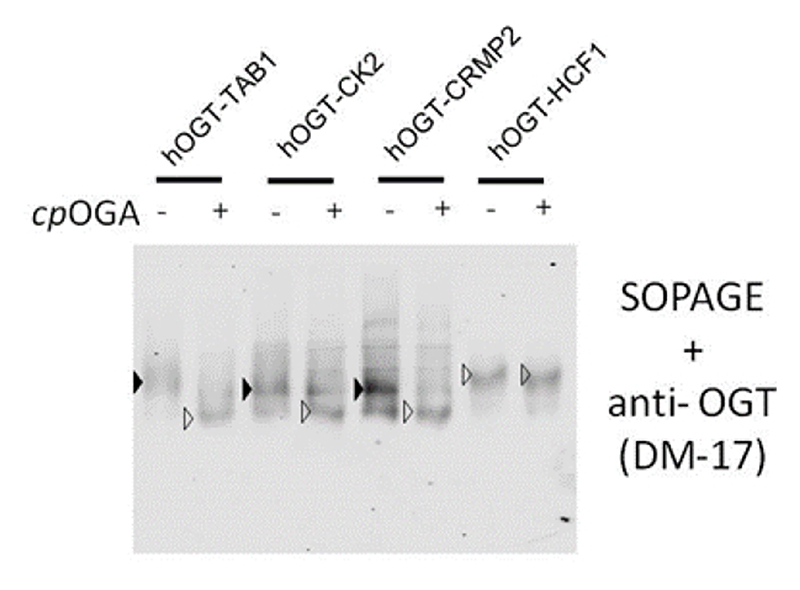
Fig. 5. Determining O-GlcNAc stoichiometry of selected proteins.
Peptide-hOGT fusions were analysed by SOPAGE and blotted with anti-OGT antibody. O-GlcNAcylated and non-glycosylated bands were identified by comparing the pattern before and after CpOGA treatment, and are indicated by solid and empty triangles, respectively.

