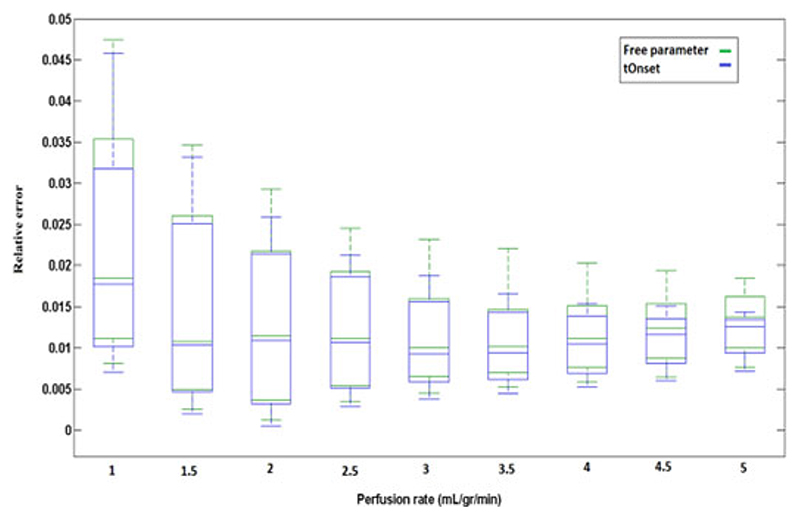
Fig. 1.
Box plot representing the relative error (r) in estimation of MBF using Fermi method when τd has been kept as a free global parameter (Green/Dashed box) and when optimized t Onset has been used at different flow rates (Blue/Solid box). At each flow rate the range of CNR varies from 5 to 30. Sensitivity of the quantification methods has decreased as the flow rates increased.

