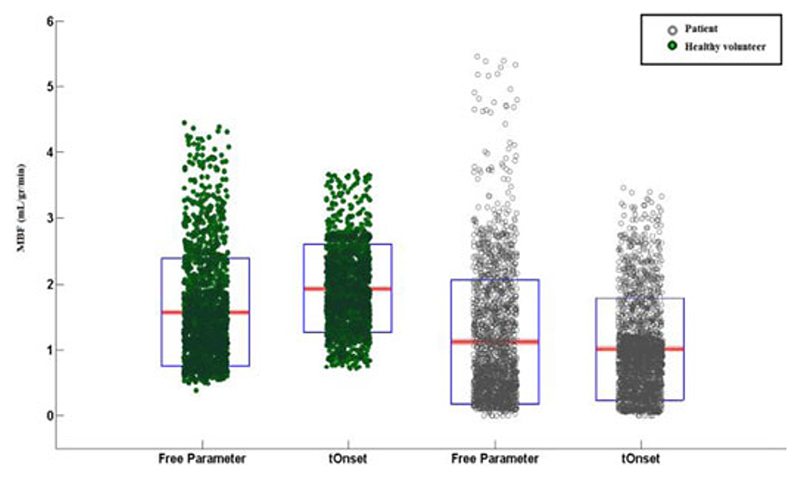
Fig. 10.
Scatter-box plot representing the estimated voxel wise MBF values in a patient with RCA disease (empty circle/grey) and a healthy volunteer (filled circles/green), comparing results obtained using an optimized tOnset with keeping as a free global parameter. Each individual green dot shows the estimated MBF at each voxel and they have been spread for visualization reasons and clarity. On each blue box, the central red mark is the median; the edges of the box are the 25th and 75th percentiles.

