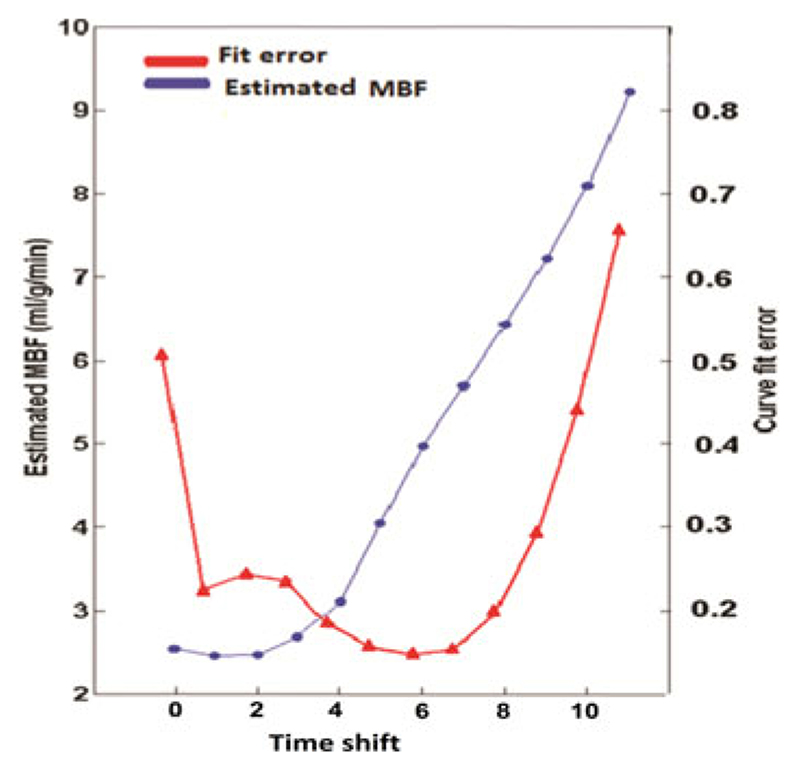
Fig. 4.
Estimated MBF (blue circles) with its corresponding curve fit error (red triangles) for a random voxel in perfusion phantom with MBFgs = 5 mL/(g·min). The horizontal axis shows the shift of the starting t Onset. The dynamic that gives the smallest curve fit error corresponds to the smallest absolute error. Here, t rel is equal to timeshift + 1 as the sequential process starts form t AIF + 1 (t rel = timeshift + 1). These results demonstrate that the sequential deconvolution algorithm can be used to detect the optimized t Onset.

