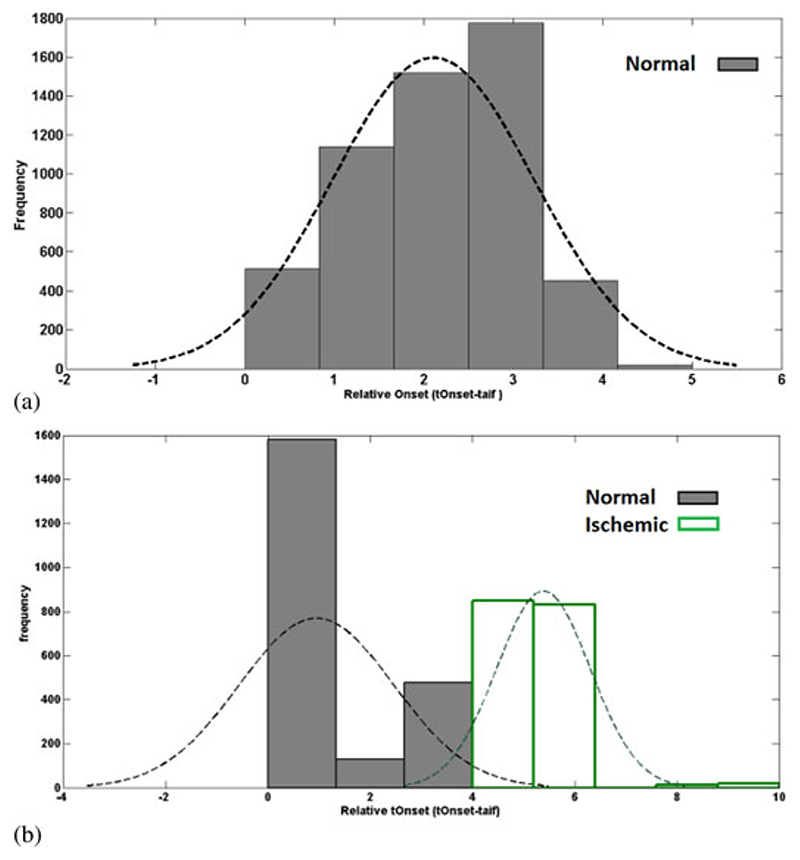
Fig. 8.
Histogram of the relative t Onset data in a group of (a) healthy volunteers and (b) patients. In the healthy volunteers group, relative tOnset has a homogenous distribution. The distribution of the values in patient’s pool is divided into two groups. First one is between 0 and 4 s, which corresponds to normal areas. Second group of values that are between 4 and 10 s are associated with the ischemic areas in the patients.

