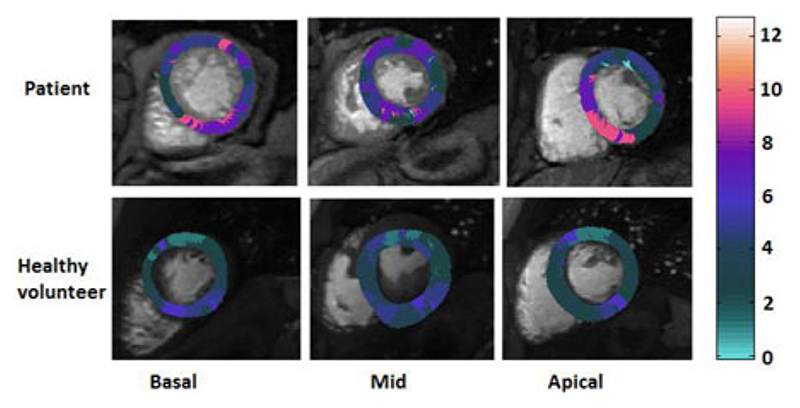
Fig. 9.
Delay maps illustrating the relative t Onset (t rel) in (top row) apatient with right coronary artery (RCA) disease and (bottom row) a healthy volunteer. The inhomogeneity of the t Onset in the tissue is apparent in the patient’s t Onset map. The healthy volunteer delay map showed to have a relatively homogenous distribution of t Onset. The difference between tOnset in voxels makes voxelwise quantification of MBF without using their real onset time inadequate.

