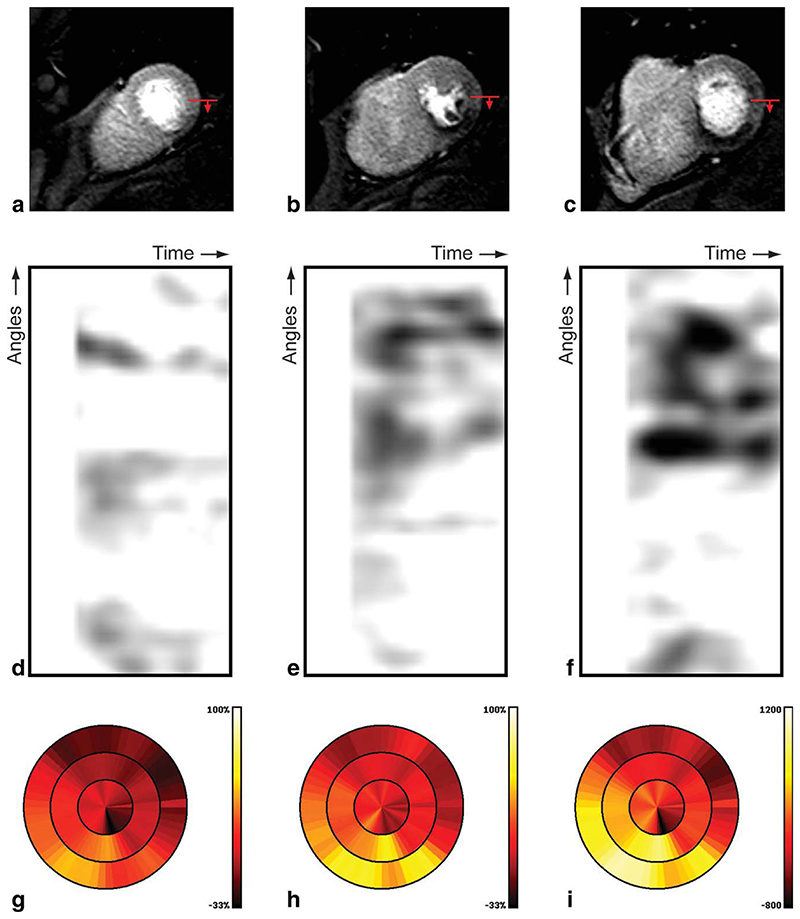
Fig. 7.
Results for a patient with abnormal perfusion, including the original high resolution CMR perfusion images at apical (a), mid (b), and basal (c) position; the red arrow indicates the start and direction of the gradientogram (top-bottom), gradientograms for the apical (d), mid (e), and basal (f) position, and bull’s eye plots displaying for all slices the mean gradient (g), peak gradient (h), and cumulative gradient (i); bright (yellow) is worse.

