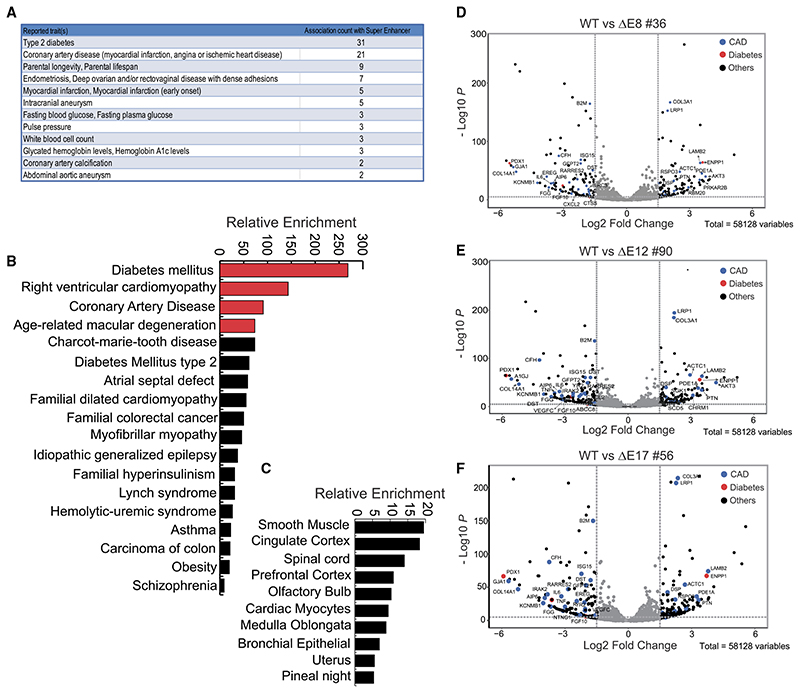
Figure 7. Dysregulated genes upon enhancer deletions corroborate with disease association of 9p21 locus.
(A) Chart from GWAS catalog tool shows the disease terms of GWAS variants and their counts present within the enhancer region (E8–E21).
(B) Graph from Enrichr tool shows the relative enrichment of disease terms based on dysregulated genes upon the E8, E12, and E17 enhancer deletions.
(C) Graph from Enrichr tool shows the relative enrichment of dysregulated genes, also expressed in various cell types.
(D–F) Volcano plots show the log2 fold changes versus –log10p values of genes comparing WT with (D) E8, (E) E12, and (F) E17 deletions.

