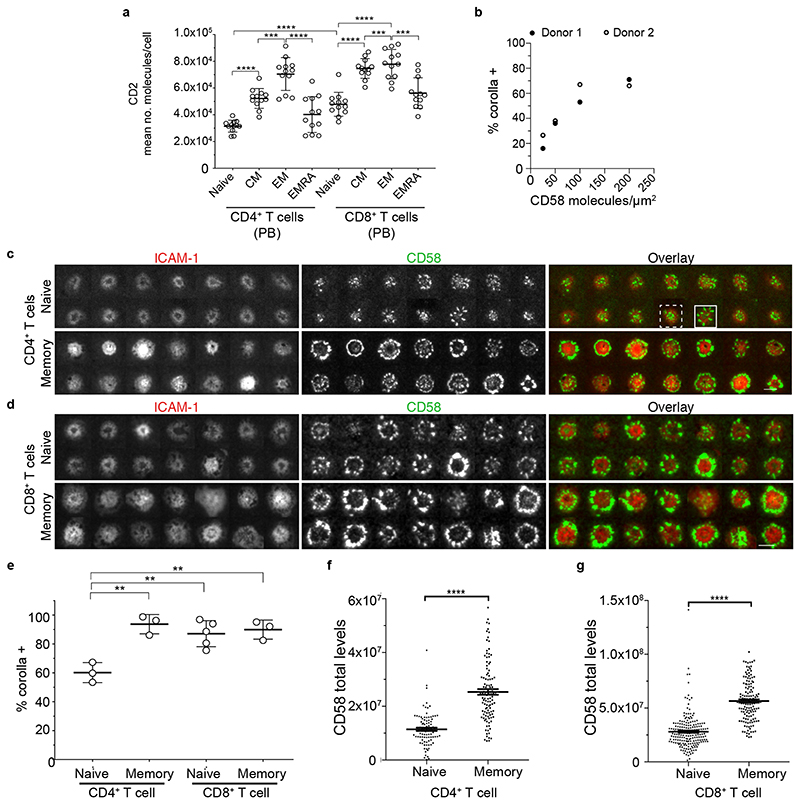
Fig. 5. Number of CD2 per human T cell predicts CD58 engagement and corolla formation.
a) After gating on single and live cells, CD4+CD3+ (left) or CD8+CD3+ (right) cells were selected and divided into naive (CD62L+CD45RA+), central memory (CD62L+CD45RA-), effector memory (CD62L-CD45RA-) and effector memory that reexpressed CD45RA (CD62L-CD45RA+) to determine average CD2 absolute number per cell. Error bars, Mean±SD b) The percentage of human CD8+ T cells that formed a CD2 corolla (% corolla+) in experiments on ICAM-1, anti-CD3 presenting SLBs with titrated levels of CD58. Data from 2 donors. c) A random image selection of naive (CD62L+CD45RA-) or memory (CD45RA-) CD4+ T cells incubated on ICAM-1 (200/μm2), anti-CD3 Fab (30/μm2) and CD58 (200/μm2) reconstituted SLBs, fixed at 15 min and imaged with TIRFM; examples of corolla positive (solid line rectangle) and corolla negative (dashed line rectangle) are shown. d) Same as in (c) but with CD8+ T cells. e) Percentage of T cells forming an IS with a CD2 corolla (corolla+) in experiments as in (c-d), was determined for naive and memory T cell subsets. Circles represent donors. **, p value <0.006, unpaired two-tailed t-test with Welch’s correction. For number of cells analyzed/subset see Supplementary Table 6. Error bars, Mean±SD. Quantification (from experiments as in (c-d)) of total CD58 accumulation in the IS of CD4+ (f) (n=91 and 110 cells, respectively) and CD8+ (g) T cell subsets (n=199 and 140, respectively). ****, p value <0.0001 with unpaired two-tailed non-parametric Mann Whitney test. A representative of three experiments is shown. Error bars, Mean±SEM.

