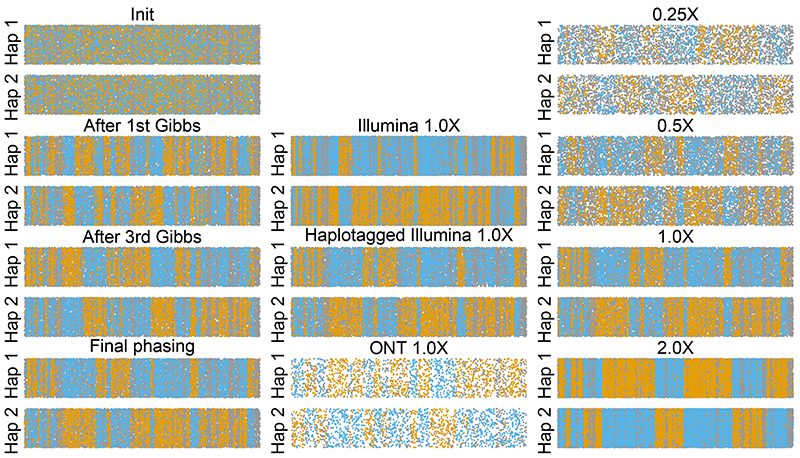
Figure 2. Assessment of read label partitioning.
Per analysis, reads are grouped based on assignment to Hap1 or Hap2, with remaining y-axis variation being jitter. x-axis gives central location of read along 20 Mbp of chromosome 20. Reads are coloured blue and orange to reflect high posterior probability of coming from truth maternal or paternal chromosome, while grey indicates equally likely from either truth chromosome. Switches between runs of orange and blue denote probable switch errors. Columns denote effect of multiple iterations (left-most, for haplotagged 1.0X), different technologies (center, for 1.0X), and coverages (right-most, for haplotagged).

