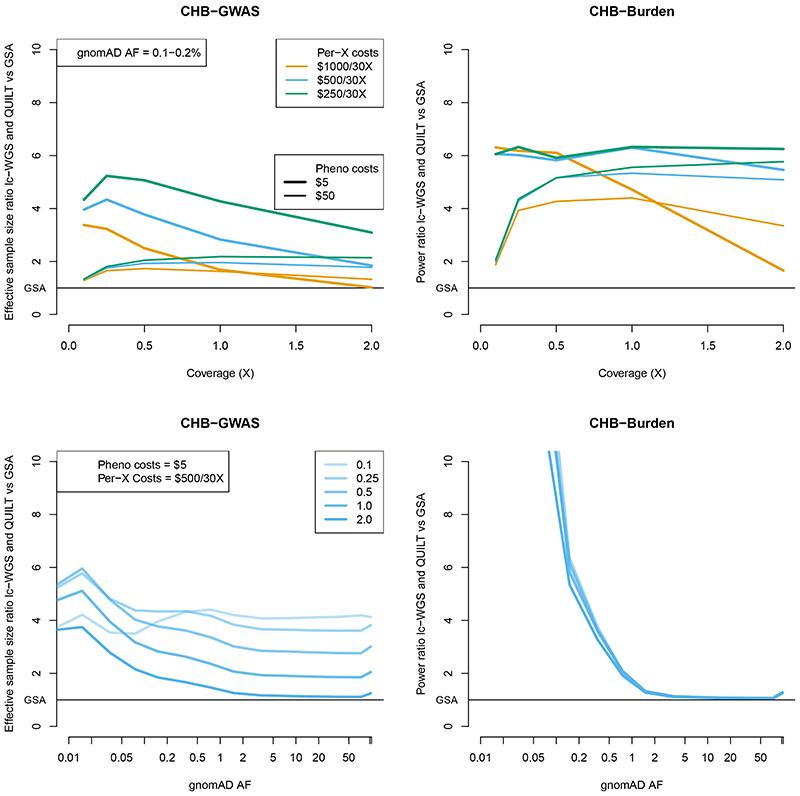
Figure 7. Relative increase in effective sample size and power using lc-WGS and QUILT.
Results are shown as a ratio of effective sample size for the GWAS setting, and a ratio of power for the burden test setting. Results use 1000 Genomes CHB imputation accuracy. Results for the top panel are given as a function of coverage, with variable phenotyping and per-X sequencing costs, for a fixed allele frequency (0.1-0.2%). Results for the bottom panel are given as a function of allele frequency, with varying coverage, assuming fixed phenotyping ($5 / sample) and per-X sequencing costs ($500 / 30X). All results assume a library preparation cost of 1.36 GBP /sample and an array cost of 30 GBP / sample.

