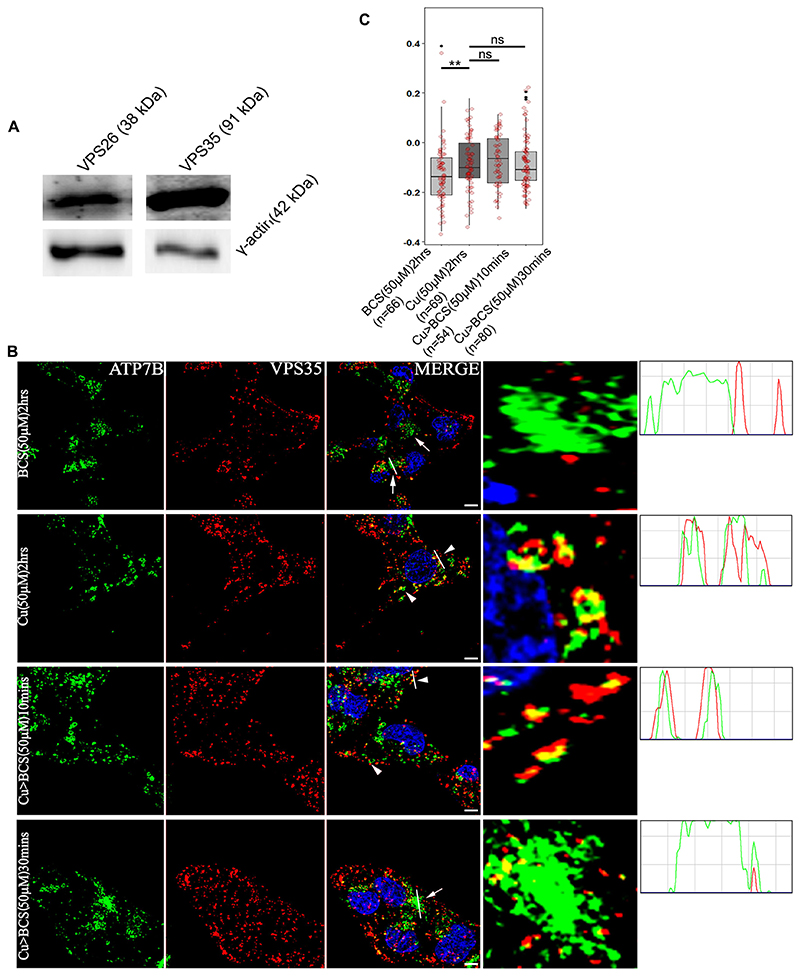
Fig. 3. ATP7B and VPS35 colocalizes at high copper.
(A) Immunoblot showing that HepG2 cells express the retromer subunits VPS26 and VPS35 (top panel). γ-actin is used as loading control (lower panel). (B) Colocalization of ATP7B (green) with retromer subunit, VPS35 (red) in copper limiting BCS (top panel), 50 μM copper (second row) and copper depletion post copper treatment (rows three and four). The overlap plots (right boxes) are from the region of the field has been magnified rightmost images) show the extent of overlap of green and red at lines drawn through the signals (marked by arrowor arrowhead). Arrowheads represent vesicularized ATP7B and arrows represents perinuclear ATP7B. the line through the selected region of the image represents the overlap between green and red signals and has been magnified (rightmost image). Blue signal represents DAPI staining for nucleus. Scale bars: 5 μm. (C) Pearson’s correlation coefficient of colocalization between ATP7B and VPS35 at different copper conditions demonstrated by box plot with jitter points. The box represents the 25–75th percentiles, and the median is indicated. The whiskers show the data points within the range of 1.5× interquartile range (IQR) from the 1st and 3rd quartile. **P<0.01; ns, not significant (non-parametric Mann–Whitney U test). The number (n) of cells counted to obtain the data for each condition is noted.

