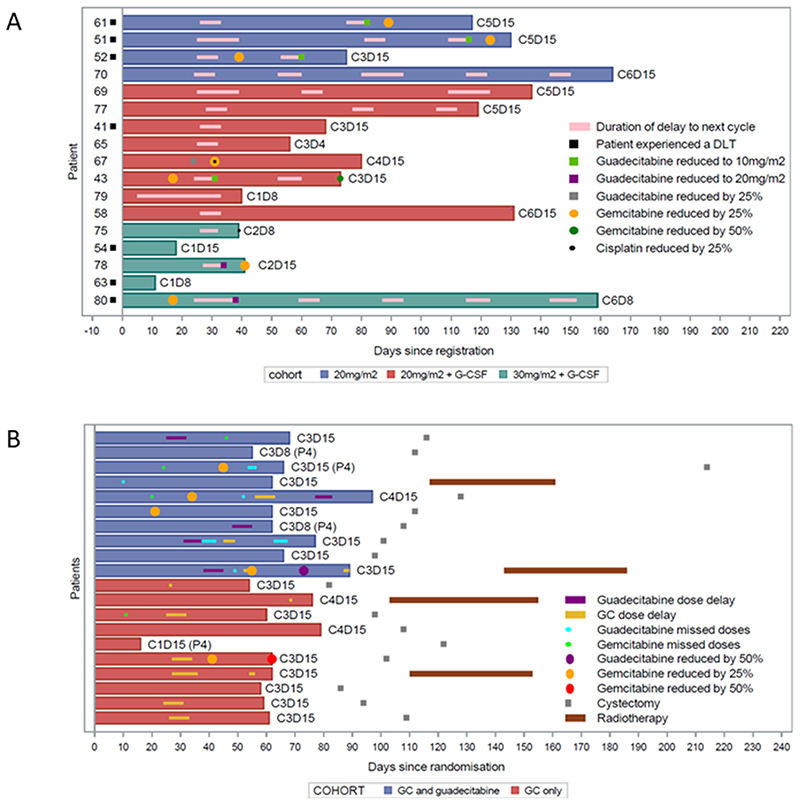
Figure 1.
Swimmers plots representing time on treatment and dose alterations within (A) the dose escalation phase and (B) the dose expansion phase. Within the expansion phase, P4 indicates patients were planned for 4 cycles of chemotherapy, with other patients planned for 3 cycles. Note: one patient within the GC only control arm discontinued trial treatment, per protocol, due to emergent renal impairment but completed 3 further cycles of GC chemotherapy prior to cystectomy

