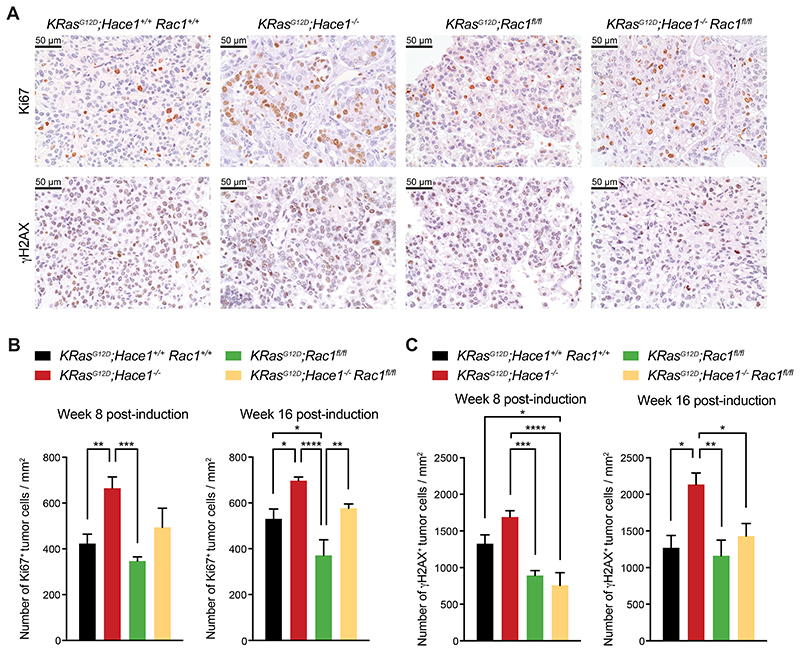
Figure 3. Elevated proliferation and DNA damage of tumor cells in Hace1–/– mice is reduced upon loss of Rac1.
(A) Representative pictures of Ki67 and γH2AX immunostaining of lungs at week 16 post lung cancer induction for KRasG12D;Hace1+/+Rac1+/+, KRasG12D;Hace1–/–, KRasG12D;Rac1fl/fl and KRasG12D;Hace1–/–Rac1fl/fl mice. Scale bars, 50μm. (B) Quantification of Ki67+ and (C) γH2AX+ tumor cells at week 8 (left panels) and 16 (right) post lung cancer induction for KRasG12D;Hace1+/+Rac1+/+, KRasG12D;Hace1–/–, KRasG12D;Rac1fl/fl and KRasG12D;Hace1–/–Rac1fl/fl mice. * P<0.05, ** P<0.01, *** P<0.001, **** P<0.0001 (One-way ANOVA, Tukey’s post-hoc test, n 3 mice per cohort). Data in (B) and (C) are presented as mean values SEM.

