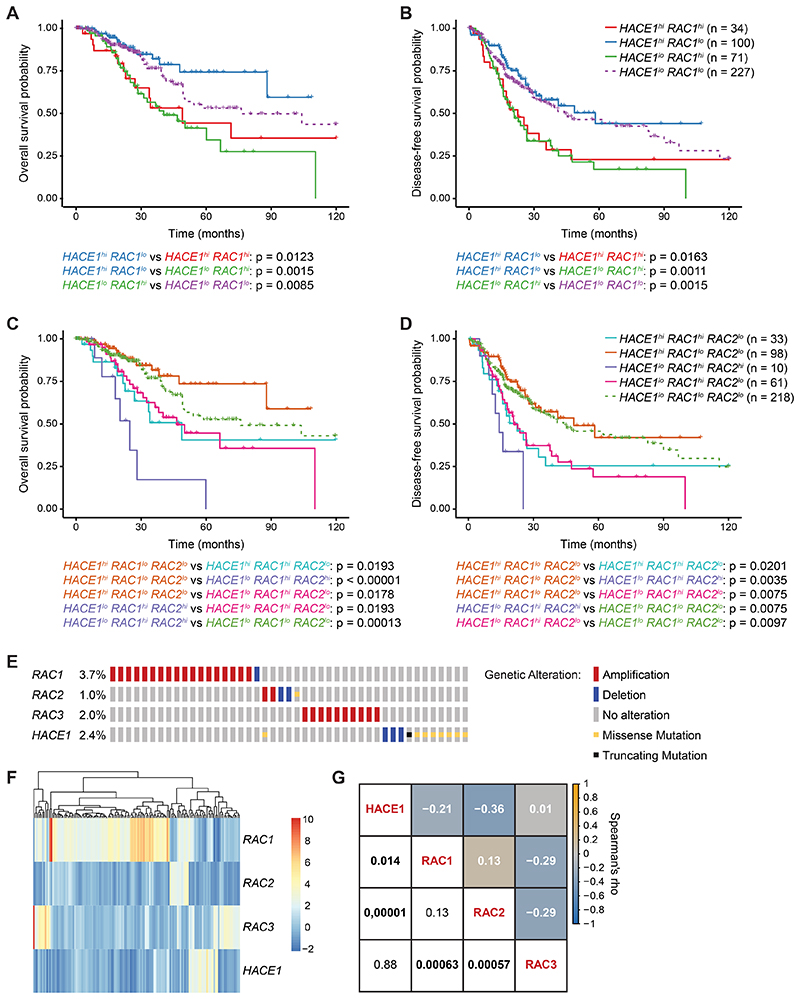
Figure 6. HACE1/RAC are deregulated in lung adenocarcinoma patients.
(A) Kaplan-Meier curves of overall survival and (B) disease-free survival for lung adenocarcinoma patients, based on HACE1 and RAC1 mRNA expression. (C) Kaplan-Meier curves of overall survival and (D) disease-free survival for lung adenocarcinoma patients, based on HACE1, RAC1 and RAC2 mRNA expression. (E) Schematic representation of genetic alterations in HACE1, RAC1, RAC2 and RAC3 in lung adenocarcinoma patients from the TCGA (PanCancer Atlas) data set for 507 cases. Color coding indicates mutation types: red, amplification; blue, homozygous deletion; yellow, missense mutation; black, truncating mutation. Percentages (%) of cases with alteration in HACE1, RAC1, RAC2 and RAC3 are indicated. Only altered cases are shown. (F) Heatmap of gene expression profiles of HACE1, RAC1, RAC2 and RAC3 in lung adenocarcinoma patients. Each row represents the expression of either HACE1, RAC1, RAC2 or RAC3. Each line corresponds to one lung cancer patient. Z-score (RNA Seq V2 RSEM) is shown from 10 (red, highest expression) to -2 (blue, lowest expression). The mRNA expression level in a single sample is depicted according to the color scale. (G) Correlation matrix showing Spearman’s rank correlation of HACE1, RAC1, RAC2 and RAC3 mRNA expression profiles. Correlation coefficients are shown in white and the associated p-values in black (statistically significant values with P<0.05 in bold). Orange and blue colors indicate positive and negative correlations, respectively, beige indicates no correlation.

