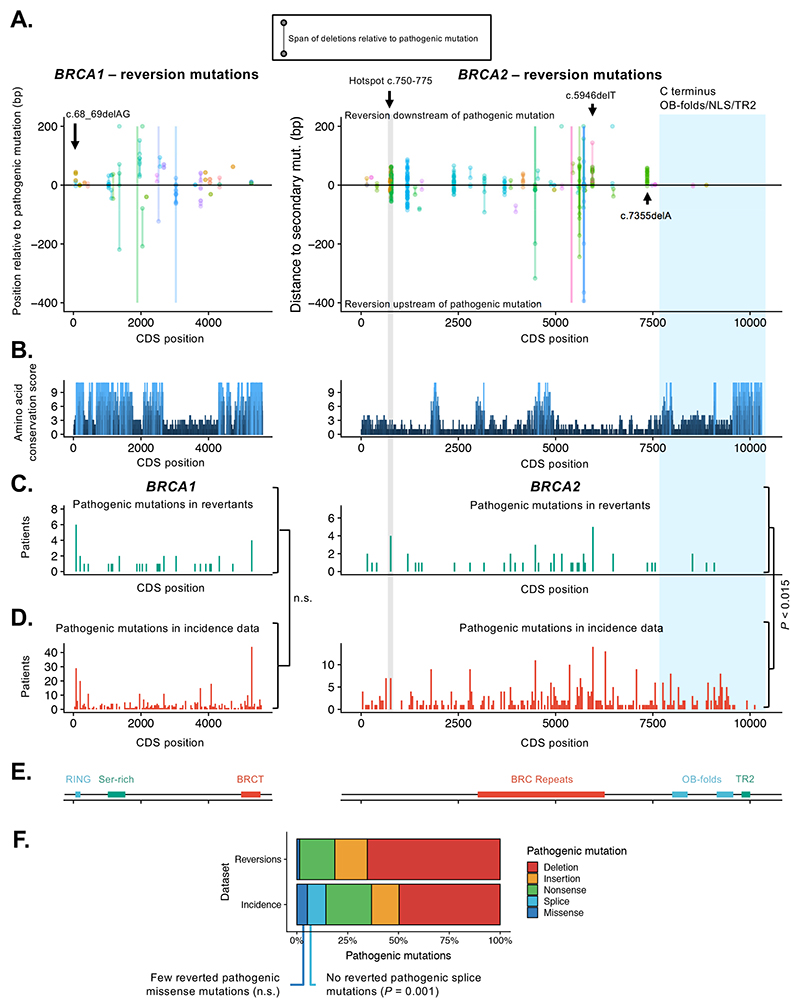
Figure 2. Directionality, hot and cold spots for reversion mutations.
A. Scatter plots showing orientation (5’/upstream or 3’/downstream) of all reversions relative to original pathogenic mutation in BRCA1 (left) or BRCA2 (right). The start and end positions of each reversion mutation (i.e. the start and end of deleted regions) are joined by lines; insertions are not shown. All positions are shown in CDS coordinates. In a few cases deletions extend beyond the plot boundaries, denoted by lines without a terminating point. For the majority of pathogenic mutations, reversion mutations do not have a directional bias and are seen both upstream and downstream of the pathogenic mutation. However, for some pathogenic mutations, e.g. BRCA2 c.5946delT and BRCA2:c.7355delA, second site reversions are biased to the DNA sequence downstream of the pathogenic mutation. There is some evidence of a hotspot for reversion mutations at BRCA2 position c.750-775 (highlighted in grey) and for a desert at the BRCA2 C-terminus (highlighted in blue). Colors of points and lines denote different studies (colors are repeated). B. Conservation of amino acid sequence in BRCA1 (left) and BRCA2 (right) mapped onto CDS position for BRCA1 and BRCA2, defined by conservation scores (see methods) determined by the alignment of 11 mammalian species. Notable peaks of conservation in BRCA2 are seen in the BRC region and the C-terminal OB and TR2 domains. C. Histogram illustrating the frequency of pathogenic mutations in the reversion dataset annotated by CDS position in BRCA1 or BRCA2. Pathogenic mutations are shown in 40-bp bins. Two regions of BRCA2 are highlighted; the candidate reversion hotspot at c.750-775 (grey) and C-terminal region (blue). D. Histogram illustrating the frequency of pathogenic mutations in BRCA1 or BRCA2 in clinical studies covering breast, ovarian, pancreatic and prostate cancer (“Incidence” data, see Methods), plotted as in (C). The distribution of reverting mutations in BRCA1 (shown in (C)) was not significantly different from the distribution of BRCA1 mutations in the Incidence dataset (P = 0.21, two-sided Kolmogorov-Smirnov test). The frequency of reversions 3’ to CDS position 7617 of BRCA2 (exon 16 onwards) was significantly lower than expected frequency based on TCGA mutation data (P < 0.015, permutation test). E. Domain structure of BRCA1 and BRCA2 proteins annotated by CDS position. F. Bar chart illustrating the frequency of different pathogenic mutation types among reversions (upper) and compared to mutation types in Incidence data (lower).

