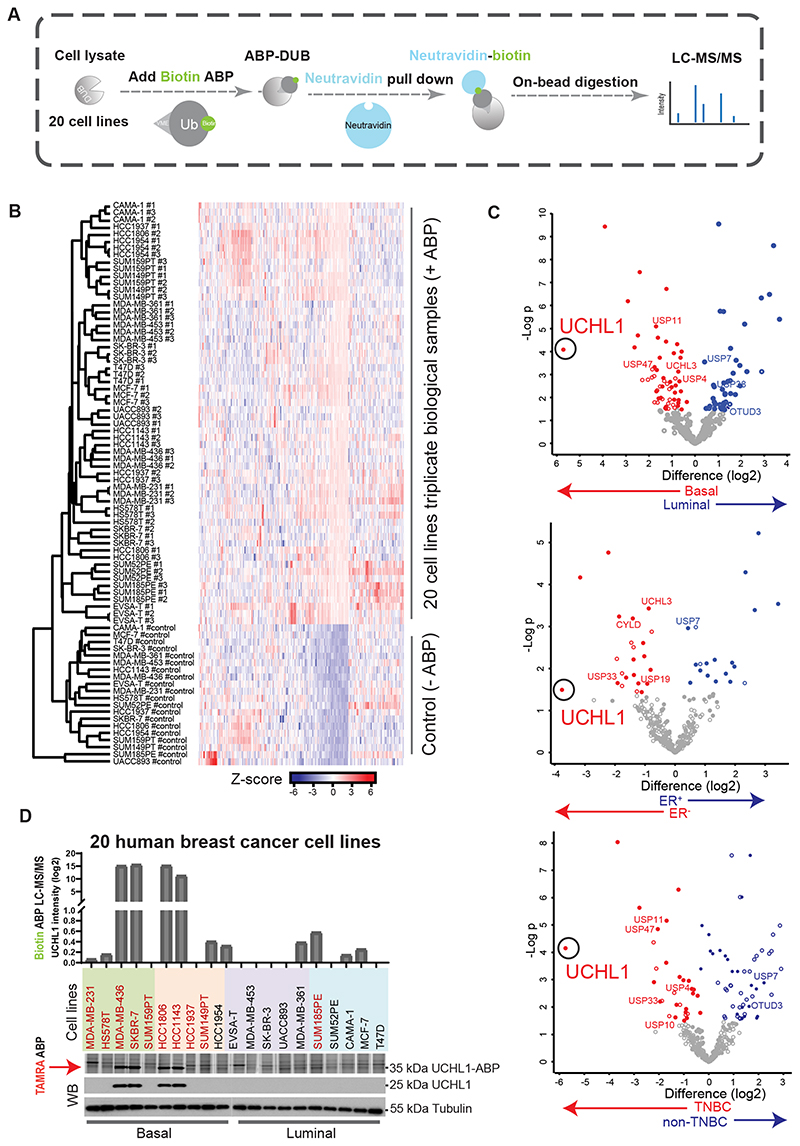
Figure 2. Quantitative DUB activity-based proteomic profiling identified UCHL1 as being selectively highly active in TNBC cell lines.
A, Schematic overview of quantitative DUB activity profiling with Biotin ABP. B, Heatmap depicting sample clustering considering Z-score of proteins identified by LC-MS/MS after Biotin-ABP profiling. The tree indicates Euclidean distances between samples. C, Scatterplots depicting statistical differences between cell lines grouped by tumor subtype. A filled dot indicates that a protein is statistically significantly different between any of the groups of study and the control sample set. An empty dot indicates that there is no statistically significant difference between any of the groups of study and the control sample group. Location of UCHL1 is marked with a circle. D, Biotin ABP, TAMRA ABP and WB analysis of UCHL1 in 20 breast cancer cell lines, TNBC cell lines were highlighted with red color. Two blots were merged together with a grey line in between two blots. Same blot was used for UCHL1 and Tubulin (loading control).

