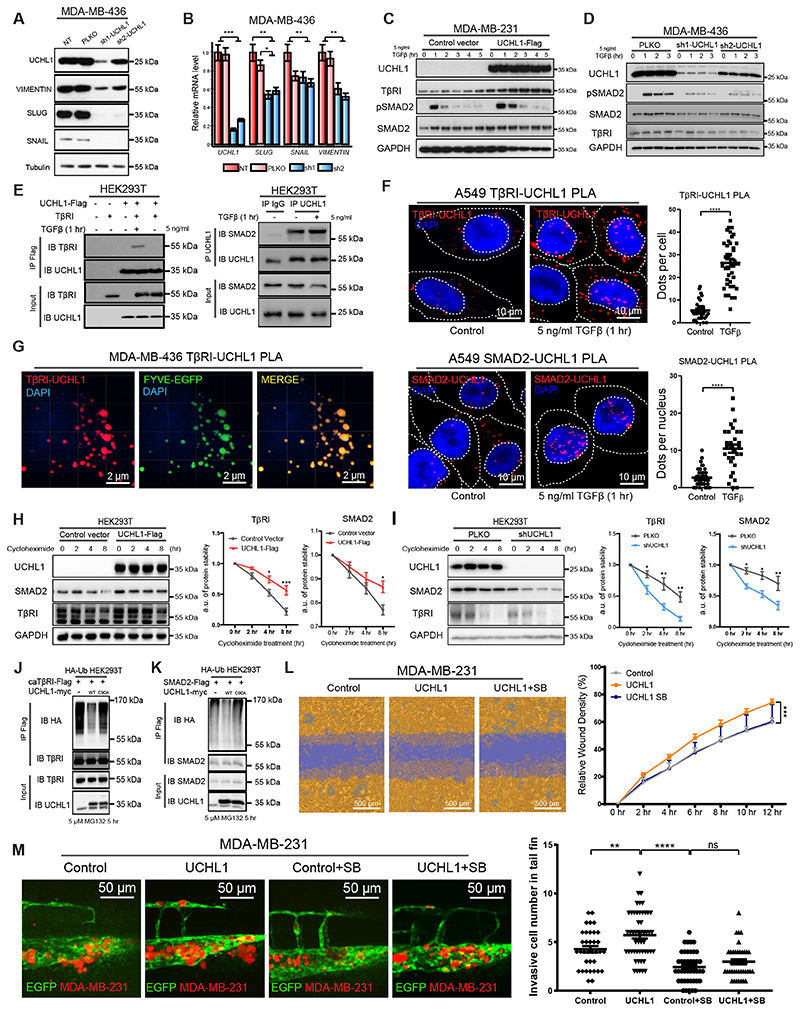
Figure 4. UCHL1 regulates mesenchymal phenotype of breast cancer cells and promotes TGFβ/SMAD signaling induced breast cancer extravasation.
A, WB analysis of mesenchymal markers in UCHL1 shRNA knock down MDA-MB-436 cells. Same blot was used for UCHL1, SLUG and Tubulin (loading control). VIMENTIN and SNAIL blotting results were obtained from another blot using the same corresponding cell lysates. B, qPCR analysis of mesenchymal markers in UCHL1 shRNA knock down MDA-MB-436 cells. **, P < 0.01, ***, P < 0.001, two-way ANOVA C, WB analysis of TβRI, SMAD2 and TGFβ-induced pSMAD2 in control and UCHL1 overexpressed MDA-MB-231 cells. Same blot was used for TβRI and GAPDH (loading control). UCHL1 and pSMAD2 blotting results were obtained from another blot using the same corresponding cell lysates. SMAD2 result were obtained from another blot using the same corresponding cell lysates. D, WB analysis of TβRI, SMAD2 and pSMAD2 in PLKO and UCHL1 shRNA knockdown MDA-MB-436 cells. Same blot was used for UCHL1, pSMAD2 and GAPDH (loading control). TβRI and SMAD2 results were derived from another two blots using the same corresponding cell lysates. E, The Interaction of UCHL1 with TβRI was detected by immunoprecipitation (IP) of Flag-tagged UCHL1 and immunoblotting (IB) for TβRI in HEK293T cells (left). The endogenous interaction of UCHL1 with SMAD2 was detected by IP of endogenous UCHL1 and IB for SMAD2 in HEK293T cells (right). IP results were obtained from same blot. Input results were from another blot using the same corresponding cell lysates as used for IP. F, PLA of TβRI-UCHL1 and SMAD2-UCHL1 in A549 cells treated with or without 5 ng/ml TGFβ for 1 hour. Representative images are shown in the left panel and signal analysis are shown in the right panel. ****, P < 0.0001, unpaired Student t test. G, PLA of TβRI-UCHL1 in MDA-MB-436 cells transfected with early endosome marker FYVE-EGFP and treated with 5 ng/ml TGFβ for 1 hour. H, Expression levels of TβRI and SMAD2 were analysed by IB in UCHL1 overexpressed and control HEK293T cells treated with 10 μg/ml cycloheximide for the indicated times. WB results are shown in the left panel, and quantification of protein stability of TβRI and SMAD2 are shown in the two panels on the right. Same blot was used for TβRI and GAPDH (loading control). UCHL1 and SMAD2 blotting results were derived from another blot using the same corresponding cell lysates. I, Expression levels of TβRI and SMAD2 were analysed by IB in PLKO and shUCHL1 HEK293T cells treated with 10 μg/ml cycloheximide for the indicated times. WB results are shown in the left panel, protein stability analysis of TβRI and SMAD2 are shown in the right panel. Same blot was used for TβRI and GAPDH (loading control). UCHL1 and SMAD2 results were derived from another blot using the same corresponding cell lysates. J, Ubiquitination of TβRI was detected by IP of Flag-tagged constitutively active TβRI (caTβRI) from HA-Ub transfected HEK293T cells with WT-UCHL1-myc or C90A-UCHL1-myc overexpression. IP results were obtained from same blot. Input results were obtained from another blot using the same corresponding cell lysates. K, Ubiquitination of SMAD2 was detected by IP of Flag-tagged SMAD2 from HA-Ub transfected HEK293T cells with WT-UCHL1-myc or C90A-UCHL1-myc overexpression. IP results were obtained from same blot. Input results were obtained from another blot using the same corresponding cell lysates. L, Real-time scratch assay results of Control, UCHL1 and UCHL1+SB MDA-MB-231 cells. Representative scratch wounds are shown at the end time point of the experiment (left). The region of the original scratch is coloured in purple and the area of cell is coloured in yellow. Relative wound density (closure) were plotted at indicate times (right). M, In vivo zebrafish extravasation assay of UCHL1 overexpressed and control vector expressed MDA-MB-231 cells treated with or without TβRI kinase inhibitor SB-431542. SB groups zebrafish were treated with 5 μM inhibitor in the egg water for 6 days after injection, and refreshed every other day. **, P < 0.01, ****, P < 0.0001, two-way ANOVA. Representative images from 4 groups with zoom in of the tail fin area are shown in the left panel. Analysis of invasive cell number of Control, Control+SB, UCHL1 and UCHL1+SB groups in zebrafish extravasation assay are shown in the right panel.

