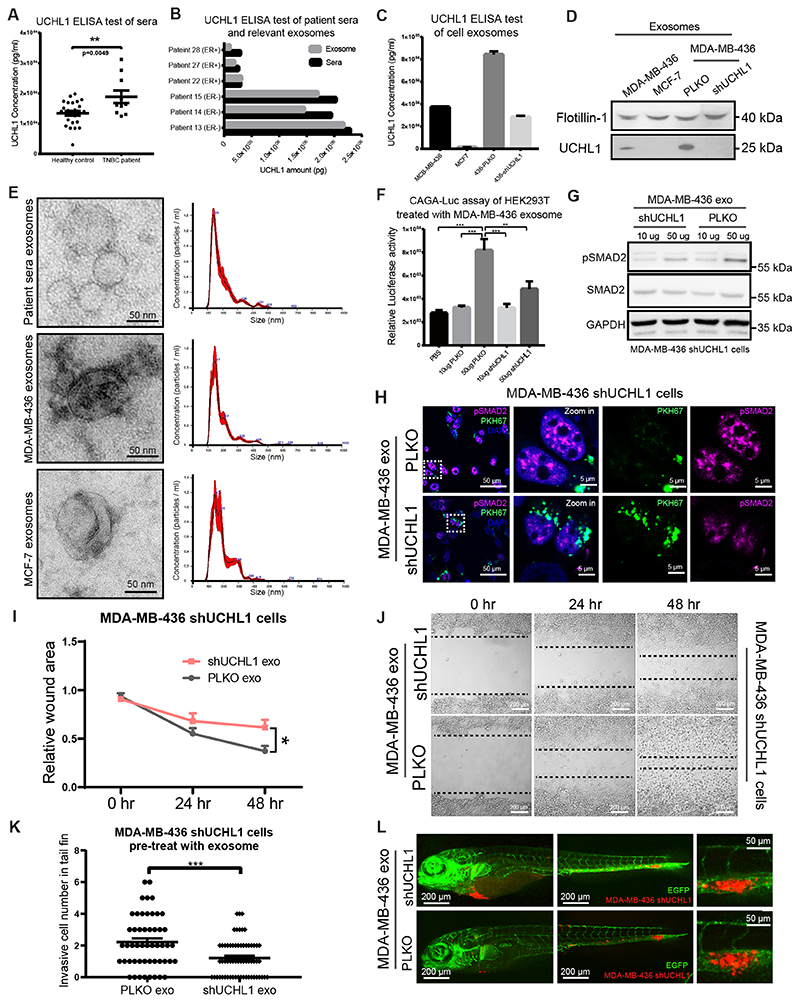
Figure 6. UCHL1+ exosomes upregulate TGFβ signaling and serves as blood-based biomarker for aggressive breast cancer.
A, ELISA analysis of UCHL1 levels in serum samples from healthy donors and TNBC patients. **, P < 0.01, unpaired Student t test. B, ELISA analysis of UCHL1 level in serum and relative exosomes from 6 breast cancer patients. C, ELISA analysis of UCHL1 level in exosomes from breast cancer cell lines. D, WB analysis of exosomes maker Flotillin-1 and UCHL1 in exosomes from four breast cancer cell lines. Same blot was used for UCHL1 and Flotillin-1 (loading control). E, TEM imaging of exosomes from patient serum and breast cancer cell lines (left). Nanoparticle tracking analysis (NTA) of relative exosomes (right). X-axis represents exosomes size distribution. Y-axis shows the concentration of exosomes. F, CAGA12-Luc transcriptional reporter analysis of HEK293T cells treated with UCHL1 high or low exosomes isolated from PLKO or shUCHL1 MDA-MB-436 cells. **, P < 0.01, ***, P < 0.001, two-way ANOVA. G, WB analysis of SMAD2 and pSMAD2 in MDA-MB-436 UCHL1 stable known down cells treated with exosomes isolated from PLKO or shUCHL1 MDA-MB-436 cells. Same blot was used for pSMAD2 and GAPDH (loading control). SMAD2 blotting results were obtained from another blot using the same corresponding cell lysates. H, Immunofluorescence staining of pSMAD2 in MDA-MB-436 UCHL1 stable known down cells treated with exosomes isolated from PLKO or shUCHL1 MDA-MB-436 cells labelled with green PKH67 exosomes dye. I, In vitro scratch wound healing assay of shUCHL1 MDA-MB-436 cells pre-treated with exosomes isolated from PLKO or shUCHL1 MDA-MB-436 cells for 24 hr, time-lapse imaging was carried out for 48 hours, images were taken every hour. Relative wound areas were analysed for each group at indicate times. *, P < 0.05, two-way ANOVA. J, Representative images of cells from PLKO and shUCHL1 groups. K, In vivo extravasation assay of zebrafish injected with shUCHL1 MDA-MB-436 cells pre-treated with exosomes isolated from PLKO or shUCHL1 MDA-MB-436 cells for 24 hr. Invasive cell number were analysed for PLKO and shUCHL1 groups. ***, P < 0.001, unpaired Student t test. L, Representative images of zebrafish from PLKO and shUCHL1 groups with zoom in of invasive cells on the right panel.

