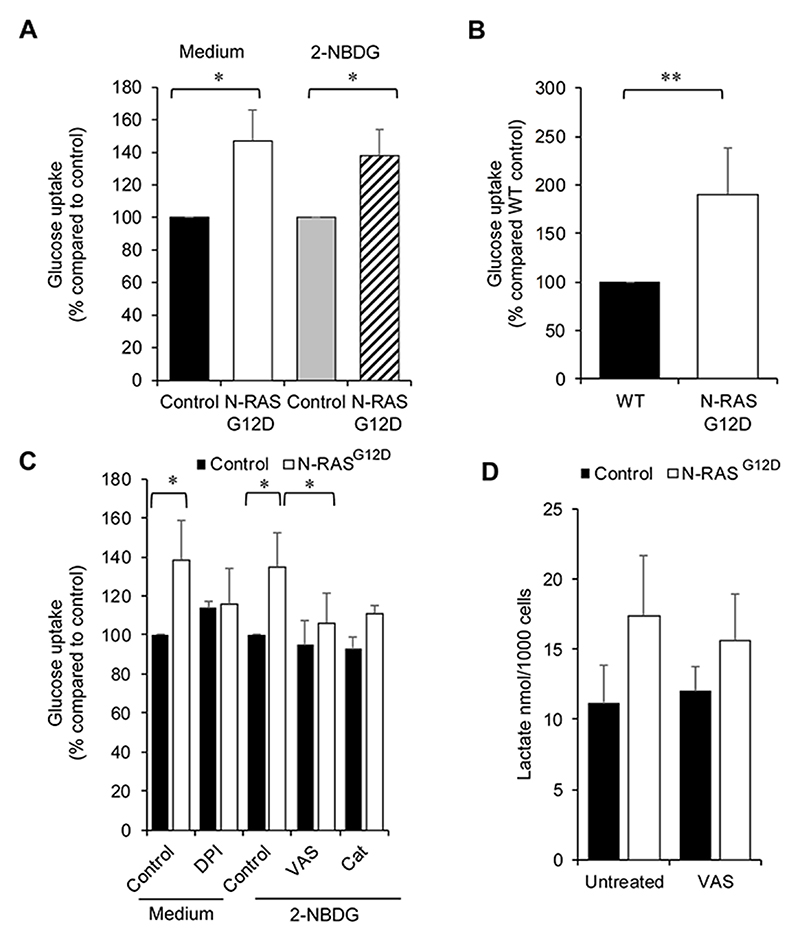
Figure 2. ROS promotes glucose uptake.
(A) ‘Medium’ - following transduction, N-RASG12D were cultured for 3 days without growth factors, glucose present in the media was assayed using a fluorometric glucose kit (n=4) (see methods) and normalised to empty-vector control. Glucose uptake in the cell is inversely proportional to the glucose remaining in the media. ‘2-NBDG’ - glucose uptake using the fluorogenic substrate 2-NBDG (normalised to control) in N-RASG12D HSPC (n=4) cultured as above. (B) Glucose uptake (normalised to Wild Type (WT) control) ex vivo in N-RASG12D bone marrow compared to WT control cells (n=8). (C) N-RASG12D HSPCs (day 5 post infection) were treated with 100nm DPI and cultured for 24 h without growth factors. Glucose in culture media (normalised to untreated control) was assayed (n=3). Glucose uptake in the cell is inversely proportional to the glucose remaining in the media. N-RASG12D HSPCs were treated with 5μM VAS-2870 (VAS; n=3) or 300mU/mL PEGylated catalase (Cat; n=2) for 24 h and glucose uptake assayed using 2-NBDG (normalised to PEG-treated control). (D) Concentration of extracellular L-lactate in culture media of transduced CD34+ cells (cultured as above) treated with 5 μM VAS-2870 as above (n=4). Data represents mean±1SD. * denotes p<0.05 and ** p<0.001 analysed by one sample t-test.

