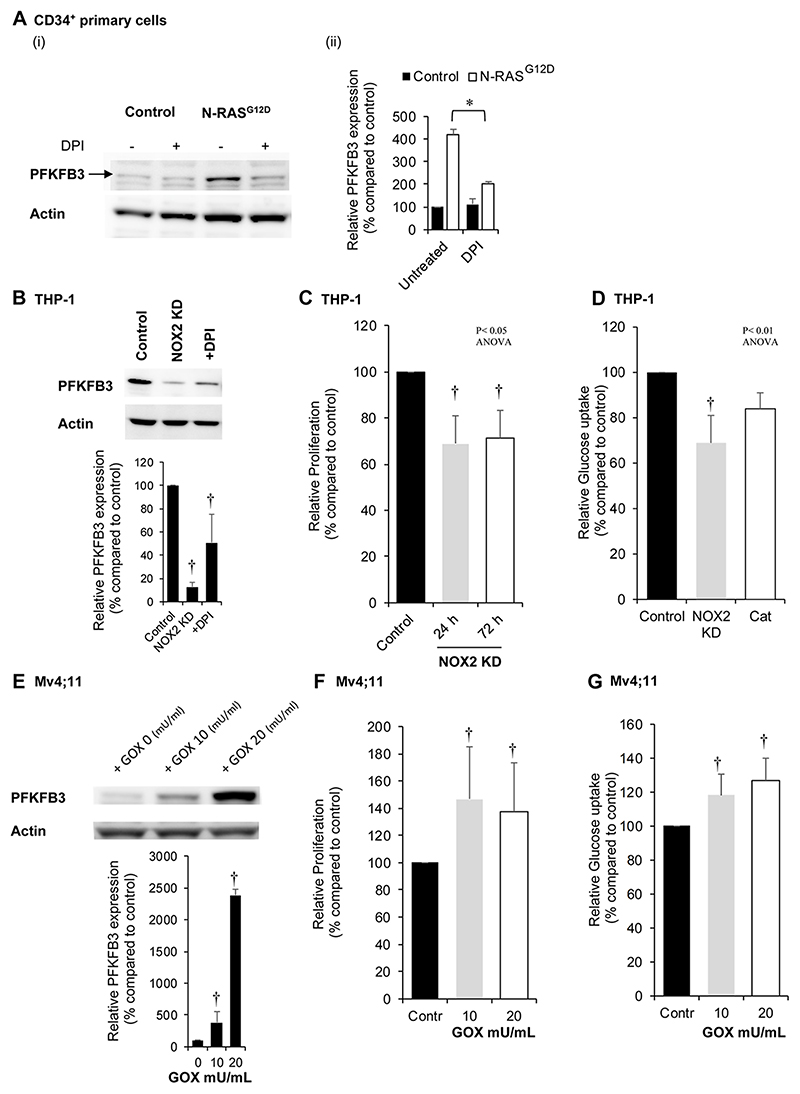
Figure 4. PFKFB3 protein expression correlates with levels of NOX2 derived extracellular ROS.
(A) Human CD34+ HSPC control and N-RASG12D (day 5 post transduction) were cultured for 24 h in cytokine free media in the presence or absence of DPI (100nM) followed by whole cell protein extraction. (i) Example western blot of PFKFB3 protein expression. (ii) Relative protein expression (as measured by pixel densitometry of equivalent regions of interest (ROI) between different samples on the same blot then normalised to control) of PFKFB3 (n=3). (B) Western blot showing PFKFB3 protein expression levels in THP-1 cells with NOX2 knocked down (KD) or cells treated with DPI (100nM) for 24 h compared to control (non-mammalian shRNA) cells. Lower panel showing relative protein expression of PFKFB3 compared to control (n=3). (C) Percentage proliferative change (normalised to control) in THP-1 cells with NOX2 KD (n>3) over 72 h. (D) Glucose uptake in single cell analysis using 2-NBDG (normalised to control) in THP-1 cells with NOX2 KD (n=4) or THP-1 cells treated with 300 mU/mL PEGylated catalase (Cat; n=6). (E) Western blot showing PFKFB3 protein expression in Mv4;11 cells treated with glucose oxidase (GOX) (10 and 20mU/mL for 24 h), which catalyses production of hydrogen peroxide (H2O2) in cell culture media; (imitating the effect of NOX2-generated ROS production). Lower panel showing relative protein expression of PFKFB3 compared to control (n=3). Correlation of PFKFB3 overexpression in Mv4;11 cells treated with GOX for 24 h on (F) proliferation and (G) glucose uptake using 2-NDBG (n=5). Actin was used as a loading control. Data represents mean±1SD. † denotes p<0.05 analysed by ANOVA with Tukey’s honestly significance difference. * denotes p<0.05 analysed by one sample t-test.

