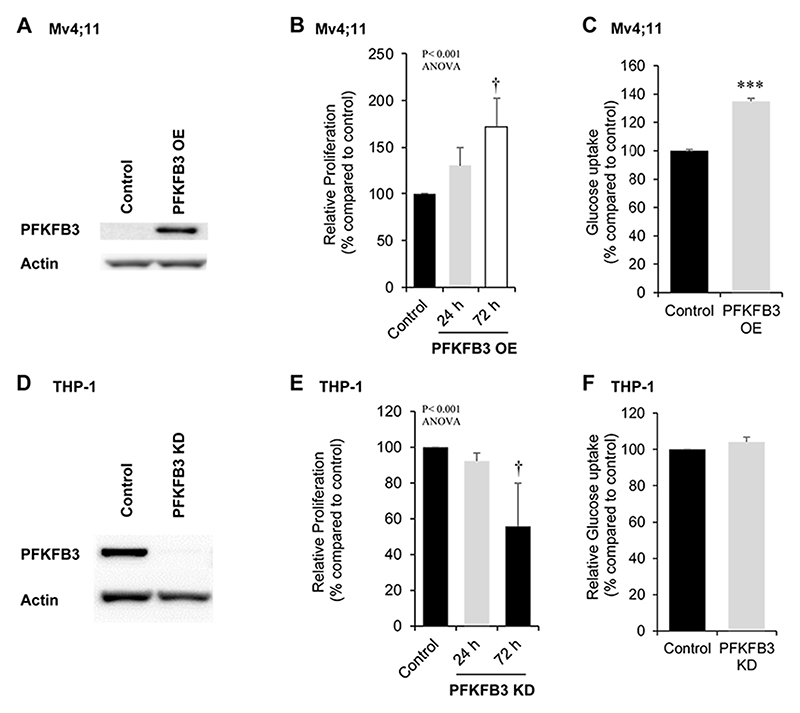
Figure 5. Effect of PFKFB3 overexpression and knock down on proliferation and glucose uptake in leukemia cells.
(A) Western blot analysis of PFKFB3 protein comparing control and PFKFB3-overexpression (OE) Mv4;11 cells. Actin was used as a loading control. (B) Percentage proliferation (normalised to control) of Mv4;11 PFKFB3 over-expressed (OE) cells compared to control (n>3). (C) Glucose uptake in Mv4;11 PFKFB3-OE cells compared to control following 72 h (n=3). Glucose was assayed in the culture media and glucose uptake in the cell is inversely proportional to the glucose remaining in the media. The concentration of glucose in the culture media (starting concentration 25nmol/μL) of PFKFB3-OE cells after 24 h was 15nmol/μL compared with 23nmol/μL in control cells. (D) Western blot analysis of PFKFB3 protein comparing control (non-mammalian targeting shRNA control) and PFKFB3 knock down (KD) in THP-1 cells. Actin was used as a loading control. (E) Percentage proliferation (normalised to control) of THP-1 PFKFB3-KD cells compared to control (n>3). (F) Glucose uptake in single cell analysis using 2-NBDG (normalised to control) of THP-1 PFKFB3-KD cells compared to control following 24h growth (n=5). Data represents mean±1SD. † denotes p<0.05 analysed by ANOVA with Tukey’s honestly significance difference. ***p<0.005 denotes statistical significance calculated by Student’s t-test calculated.

