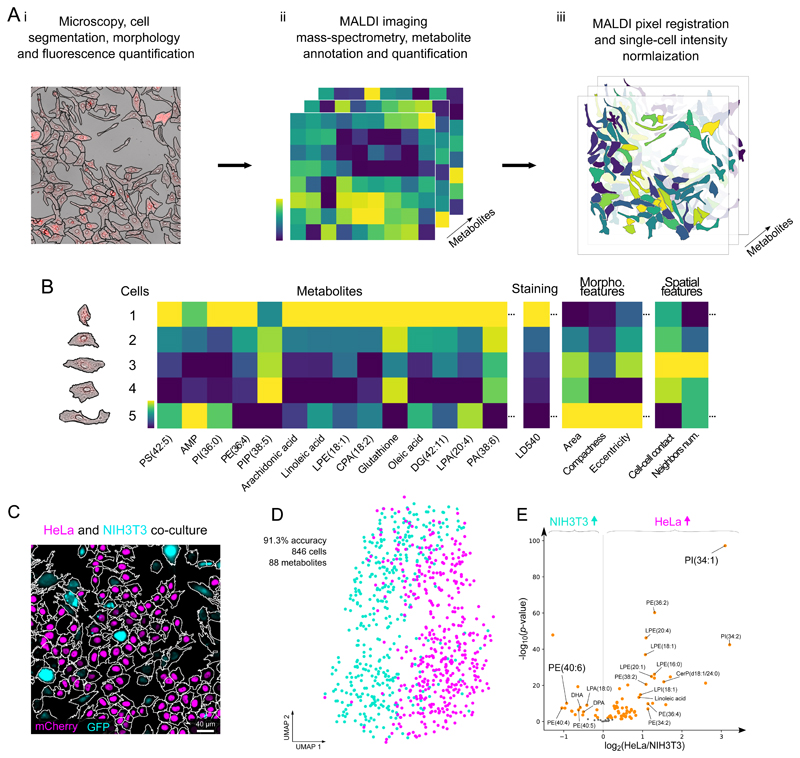
Figure 1. The SpaceM workflow and validation.
SpaceM integrates light microscopy and MALDI-imaging mass spectrometry to provide a metabolic profile obtained in situ for each cell. Segmented microscopy images help delineate cells and quantify their morphometric properties, spatial organization, and fluorescence. The cells are further subjected to MALDI-imaging mass spectrometry and metabolite annotation which reveals their metabolomes, followed by normalization. B: SpaceM provides a single-cell spatio-molecular matrix that integrates the metabolic profiles and other information obtained using microscopy. C: We validated SpaceM by predicting cell types of co-cultured human HeLa epithelial cells (H1B-mCherry, magenta) and mouse NIH3T3 fibroblasts (GFP, cyan). Representative image from 2 independent experiments. D: UMAP visualization of 846 co-cultured cells (HeLa, magenta; NIH3T3, cyan) using intensities of 88 metabolites. Unsupervised Leiden clustering applied to the metabolic profiles classified both cell types with an accuracy of 91.3% (see also Figure S7). E: Volcano plot (log2 of the fold change HeLa/NIH3T3 vs. -log10 of the two-tailed independent t-test p-value) showing differential properties of the 88 detected metabolites.

