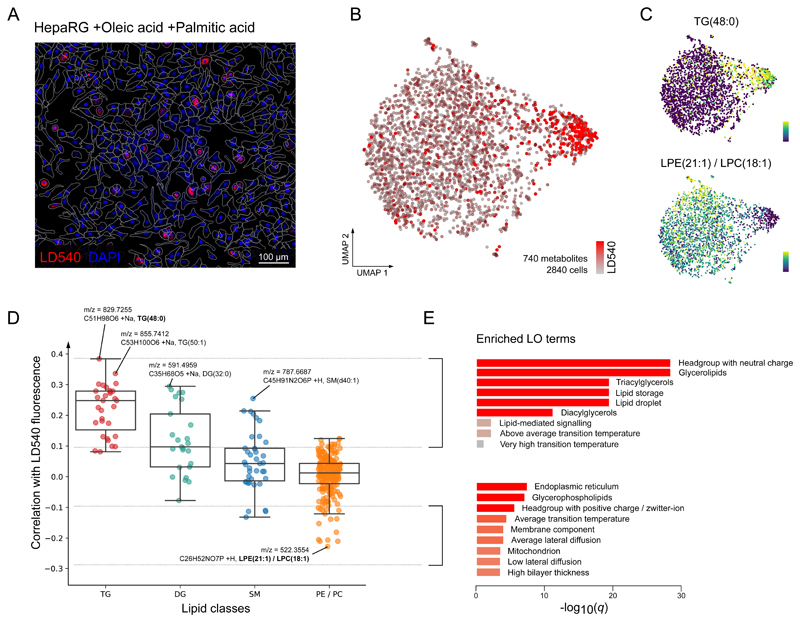
Figure 2. SpaceM identifies a steatotic subpopulation in lipid stimulated human hepatocytes.
A: Microscopy images of the human dHepaRG hepatocytes stimulated with oleic and palmitic fatty acids illustrating their heterogeneity in lipid droplets accumulation; red: LD540 staining for lipid droplets; blue: Hoechst staining for cell nuclei. Representative image from 4 independent experiments. B: UMAP visualization of single-cell metabolic profiles (740 metabolites) of 2,840 single cells revealed two co-existing subpopulations with statistically different lipid droplet levels (see also Figure S9). C: UMAP plots showing single-cell intensities of metabolites most associated with the lipid droplet accumulation: triglyceride TG(48:0), Spearman correlation r=0.38 (two-tailed test p-value=2.04e-100, ***), and an ion corresponding either to lysophosphatidylethanolamine LPE(21:1) or isomeric lysophosphatidylcholine LPC(18:1), negative Spearman r=−0.23 (two-tailed test p-value=1.09e-34, ***). D: Correlation values between LD540 and lipid intensities across 2,840 single-cells, grouped by the lipid class. Tri-(TG) and di-glycerides (DG) are the most correlated which is in line with their reported function to compose the hepatic LDs core. Tukey box plots for each lipid class: center line: median; box limits: upper and lower quartiles; whiskers: 1.5x interquartile range. E: Enriched lipid ontology terms (LO) for lipids with an LD540-correlation >0.1 and <−0.1. Enriched LO terms from lipids with a high correlation with LD540 show enrichment of the neutral lipid metabolism, TGs, DGs, and lipid droplet biology, which is expected and therefore serves as a supportive argument for the capacity of SpaceM to detect and quantify biologically relevant molecules.

