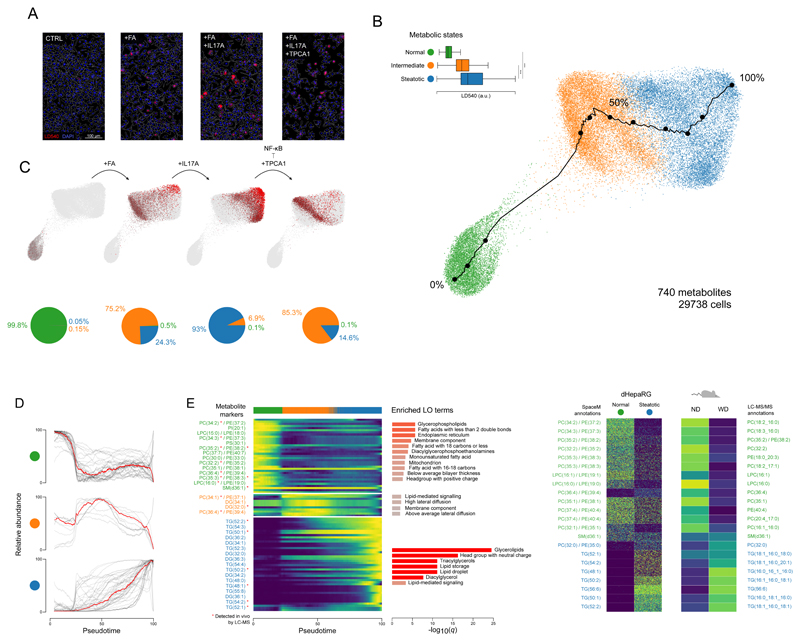
Figure 3. SpaceM discovers and characterizes metabolic states of stimulated hepatocytes, cross-validated by preclinical NASH models.
A: Microscopy images of the human dHepaRG hepatocytes (CTRL), also stimulated with: fatty acids (+FA), further with IL-17A (+FA+IL17A), and further with an NF-kB inhibitor TPCA1 (+FA+IL17A+TPCA1); red: LD540 staining for lipid droplets; blue: Hoechst for nuclei; white: cells outlines. Representative images from 4 independent experiments per culture condition. B: PAGA visualization and unsupervised Leiden clustering of single-cell metabolic profiles (740 metabolites) reveal homeostatic, intermediate, and steatotic metabolic states of 29,738 hepatocytes. LD540 levels per metabolic states (homeostatic vs steatotic, two-tailed independent t-test p-value=0, ***; intermediate vs steatotic, two-tailed independent t-test p-value=1.4e-299, ***). Tukey box plots with center line: median; box limits: upper and lower quartiles; whiskers: 1.5x interquartile range. Black line shows a pseudotime trajectory from the homeostatic to steatotic states. C: Each condition separately, with cell values of LD540 in red, highlighting the gradient of the lipid droplet accumulation from the homeostatic to steatotic state. Pie charts show the proportions of the metabolic states in each condition. D: Normalized intensities of metabolic-state markers (t-statistic >60) for all cells along the pseudotime. E: Heatmap for the metabolic-state markers from C. Red star indicates validation by LC-MS/MS in the considered mouse model. For each state, the enriched lipid ontology (LO) terms are displayed. F: Semi-quantitative validation of selected metabolic markers of the homeostatic and steatotic states in an in vivo NASH mouse model with the normal diet (ND) vs Western diet (WD). For HepaRG, intensities of 2,500 randomly-selected cells are shown for each state. For the mouse model, average LC-MS intensity (n=3 replicates) per diet group is shown. Molecular names, left: putative MS1 annotations; right: structurally-validated by LC-MS/MS. ***denotes p-value<0.001.

