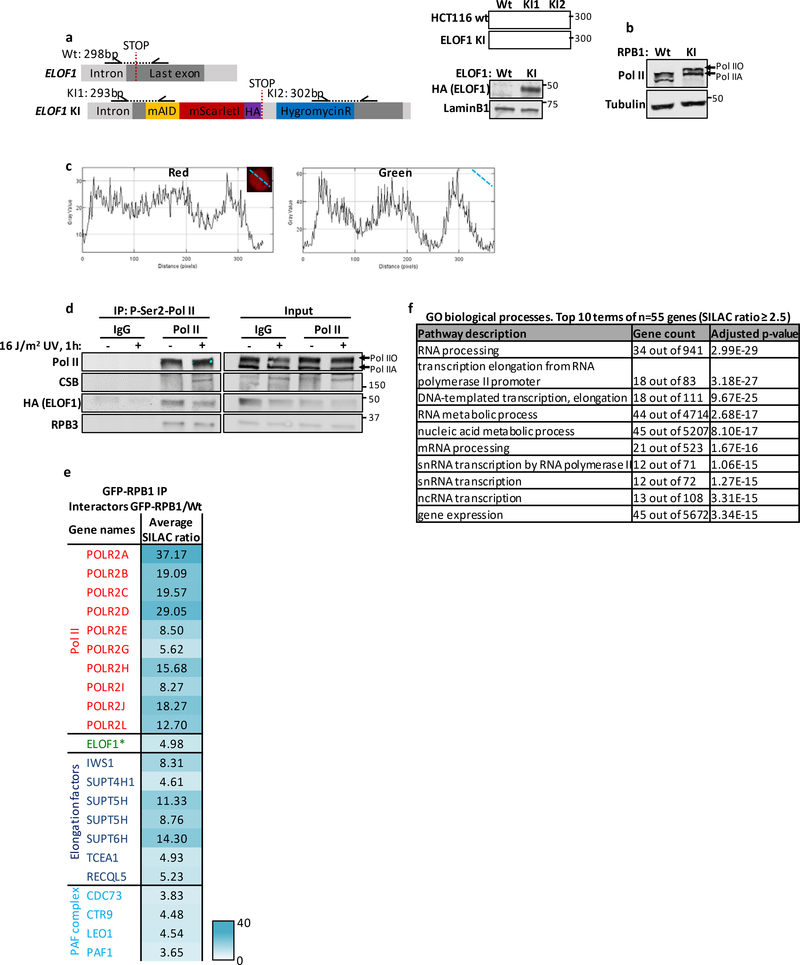
Extended data figure 2. ELOF1 is part of the Pol II complex.
(a) Left panel: Schematic of the genomic locus of ELOF1 for generating ELOF1-mScarletI-HA KI cell line. Half arrows indicate primer locations. Right panel: Genotyping PCR and immunoblot for ELOF1-KI cell line (top). LaminB1 was used as loading control (bottom). (b) Immunoblot of HCT116 GFP-RPB1 KI. Tubulin was used as loading control. (c) Histograms showing intensities of GFP and mScarletI measured over the indicated dotted line in HCT116 double KI cells. (d) Native immunoprecipitation of P-Ser2-modified Pol II in HCT116 cells followed by immunoblotting for indicated proteins. Cells were harvested 1 hour after mock treated or irradiation with 16 J/m2 UV-C. IgG was used as binding control. (e) Interaction heat map based on the SILAC ratios of MRC-5 GFP-RPB1-interacting proteins as determined by quantitative interaction proteomics. Average SILAC ratios of duplicate experiments are plotted and represent RPB1-interactors relative to empty beads. SILAC ratio >1 indicates increase in interaction. * indicates proteins quantified in one experiment. (f) Top 10 enriched GO terms (biological processes) identified using g:Profiler of 55 proteins identified as ELOF1 interactor with an average SILAC ratio of 2.5 or higher.

