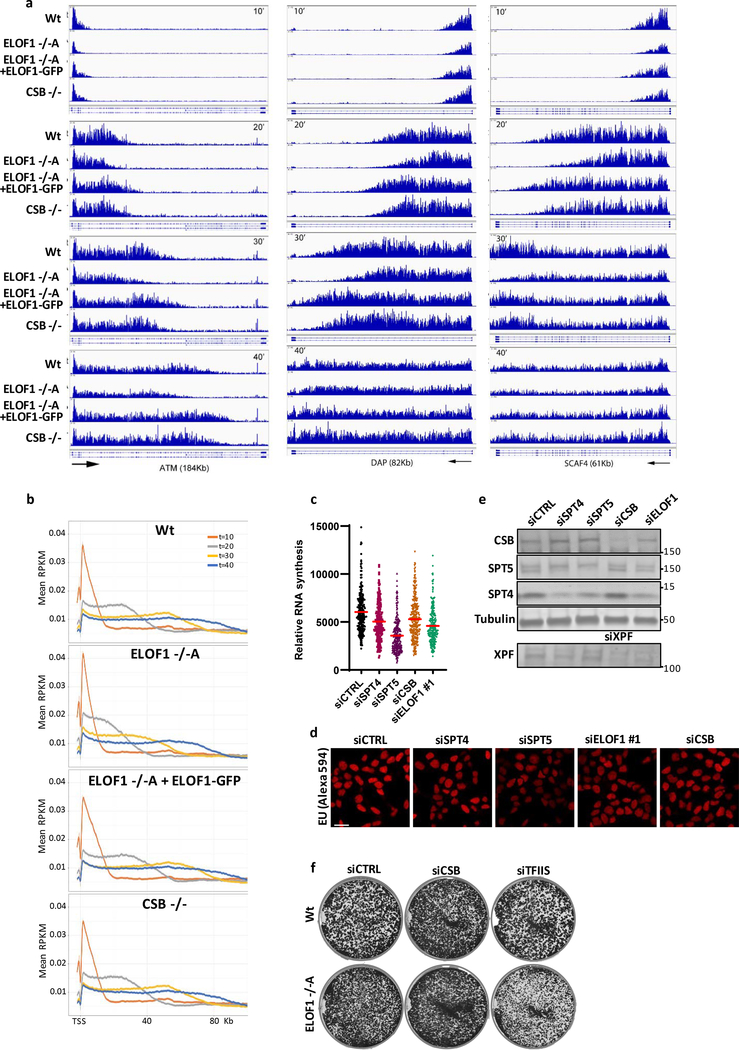
Extended data figure 3. ELOF1 stimulates transcription elongation.
(a) Browser tracks from DRB/TTchem-seq experiment at ATM, DAP and SCAF4. Results are shown 10, 20, 30 or 40 minutes after DRB release. (b) Metagene profiles of DRB/TTchem-seq in HCT116 Wt or indicated KO (−/−) cells, with ELOF1 re-expression where indicated, 10, 20, 30, or 40 minutes after DRB release for 50–100Kb long genes. (c) Transcription levels as determined by relative EU incorporation in HCT116 cells transfected with indicated siRNAs. Red lines indicate average integrated density ± SEM. siCTRL n=247, siSPT4 n=272, siSPT5 n=288, siCSB n=286, siELOF1 #1 n=285. (d) Representative images of EU incorporation in HCT116 cells transfected with indicated siRNAs. Scale bar: 20 μm. (e) Immunoblot for indicated proteins in HCT116 cells transfected with indicated siRNAs. Tubulin was used as loading control. (f) Images of HCT116 Wt and ELOF1 −/−A cells transfected with indicated siRNAs, stained with coomassie blue 10 days after transfection.

