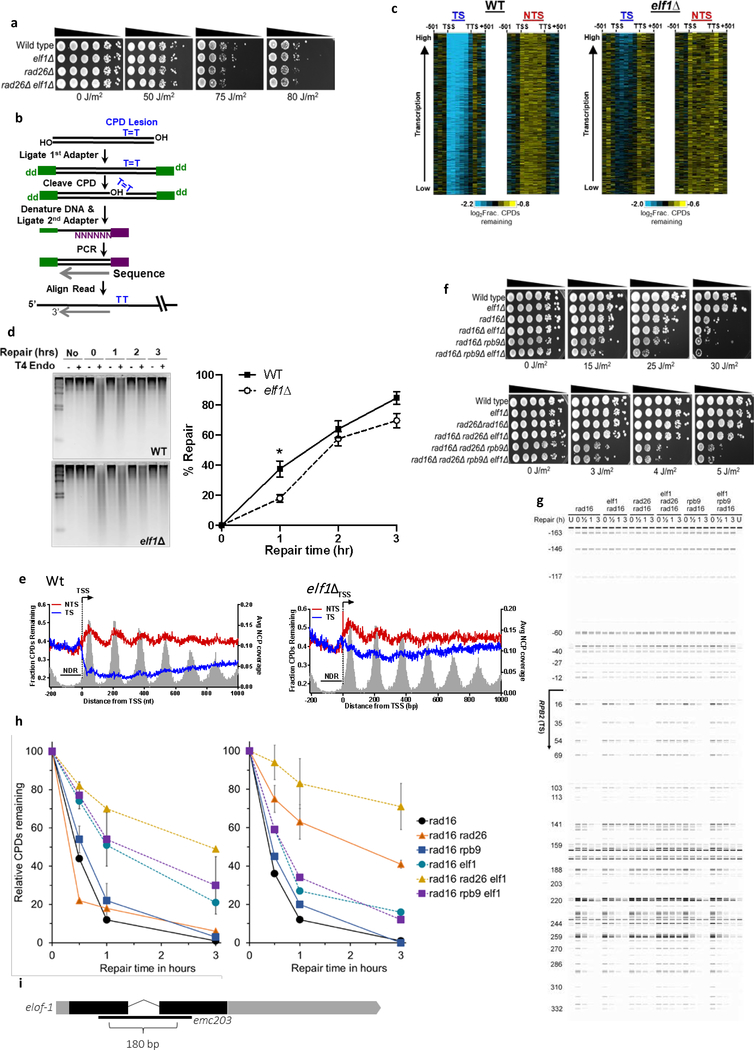
Extended data figure 5. Role of yeast elf1 in TC-NER.
(a) Indicated mutant yeast strains were serially 10-fold diluted, spotted, and exposed to indicated UV-C doses. (b) Schematic showing the CPD-seq method. Isolated DNA is sonicated and adaptors are ligated. CPDs are cleaved by T4 endonuclease V and APE1 nuclease to generate 3’ ends. Following denaturing of the DNA, ends are ligated to a second adaptor that allows CPD sequencing. (c) Gene plot analysis of CPD-seq data for ~4500 yeast genes, ordered by transcription frequency65. Plots depict unrepaired CPDs following 2-hour repair relative to no repair for both the transcribed strand (TS) and non-transcribed strand (NTS). Each row represents approximately 10 genes. TSS=transcription start site, TTS=transcription termination site. (d) Left panel: Representative gel of bulk repair of UV-induced CPD lesions in Wt and elf1Δ mutant yeast measured by T4 endonuclease V digestion and alkaline gel electrophoresis of genomic DNA isolated from UV-irradiated yeast (100 J/m2 UV-C light) after the indicated time. Right panel: Quantification of CPD repair from n=3 WT and n=4 elf1Δ experiments ±SEM. *P≤0.05 analyzed by unpaired two-sided t-test. (e) Single nucleotide resolution analysis of CPD-seq data downstream of the TSS of ~5200 yeast genes. Plots depict fraction of unrepaired CPDs following 2-hour repair relative to no repair for both TS and NTS. Nucleosome positioning data50 is shown for reference. (f) Controls for UV spotting assays shown in Fig. 4d. (g) Image showing repair of CPDs in the TS of the RPB2 gene for indicated yeast strains. The image was generated by converting sequencing reads aligned to RPB2 into bands. U: unirradiated cells. Nucleotide positions relative to TSS (+1) are indicated on the left. (h) Left: Relative percentage of CPDs remaining within 54 bp downstream of the TSS of the RPB2 gene. Right: Relative percentage of CPDs remaining in the downstream region (69–353 bp) of the RPB2 gene. Data are presented as mean values ±SD, error bars are shown for most relevant strains. (i) Representation of the C. elegans elof-1 genomic organization, depicting the 180 bp emc203 deletion allele generated with CRISPR/Cas9. Shaded boxes: exons, black: coding sequences.

