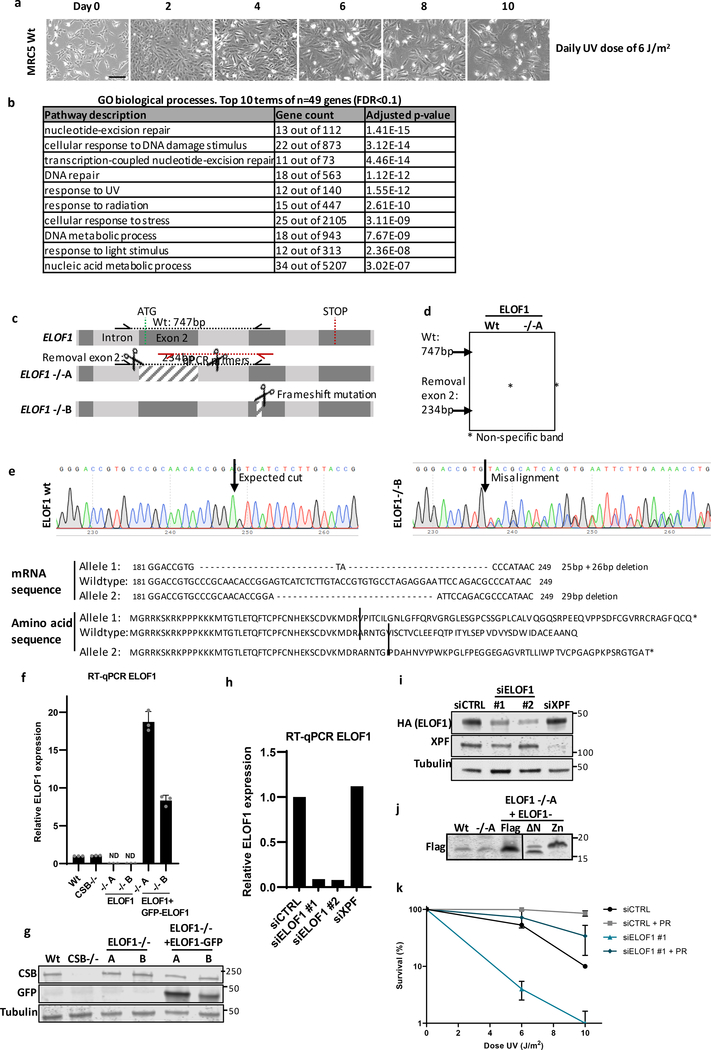
Extended data figure 1. Generation of ELOF1 knock-in and out cells.
(a) Brightfield images of MRC-5 cells irradiated with indicated doses of UV-C for 10 consecutive days. Images were taken every other day. Scale bar: 60 μm. (b) Top 10 enriched GO terms (biological process) identified using g:Profiler of UV-sensitive genes with FDR<0.1 (n=49). (c) Schematic of the genomic ELOF1 locus. Scissors indicate target regions of the sgRNAs used to generated ELOF1 KO (−/−) cells, half arrows indicate primers used for genotyping as shown in (c). Red arrows indicate location of the qPCR primers as shown in (e). (d+e) Genotyping of ELOF1 KO (−/−) cells, both originating from a single cell clone. (d) Genotyping PCR of loss of exon 2 in ELOF1 −/−A cells. (e) Top panel: Sequencing results showing frameshift mutations in the targeted genomic locus of ELOF1 −/−B. Bottom panel: Amino acid sequence of ELOF1 in ELOF1 −/−B cells. (f) Relative ELOF1 levels in indicated HCT116 Wt and ELOF1 KO (−/−) cells, with ELOF1 re-expression where indicated, as determined by RT-qPCR. Relative ELOF1 mRNA expression was normalized to GAPDH signal and levels in Wt cells were set to 1. ND=not detected n=3 ±SEM. (g) Immunoblot of indicated HCT116 cell lines showing CSB or ELOF1-GFP expression. Tubulin was used as loading control. (h) Relative ELOF1 levels in HCT116 cells transfected with indicated siRNAs as determined by RT-qPCR. Relative ELOF1 expression was normalized to GAPDH signal and siCTRL levels were set to 1. n=2 ±SEM. (i) Immunoblot showing endogenous ELOF1 and XPF levels in ELOF1-mScarletI-HA KI cells (Extended data fig. 2a) transfected with indicated siRNAs. Tubulin was used as loading control. (j) Immunoblot showing expression of Flag-tagged Wt or indicated ELOF1 mutants in HCT116 ELOF1 −/−A cells. (k) Relative colony survival of CPD photolyase cells transfected with indicated siRNAs. PR indicates CPD removal by photoreactivation. Plotted curves represent averages of n=2 ±SEM.

