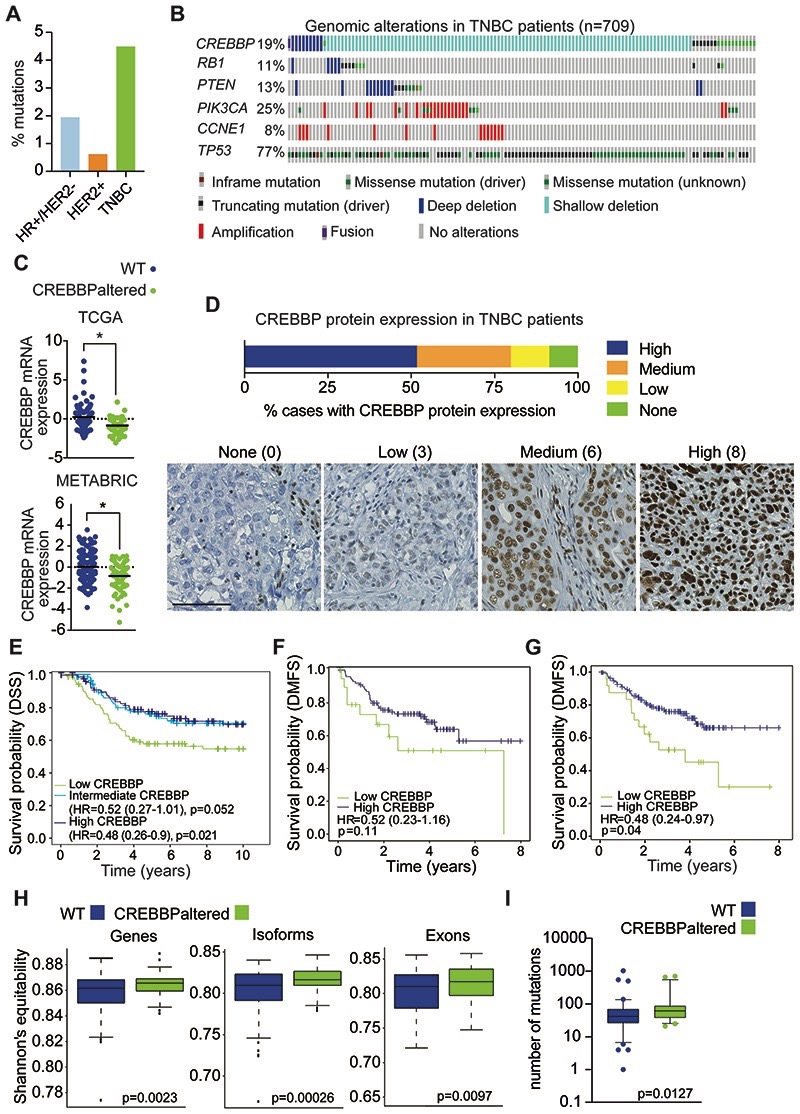
Figure 3. CREBBP protein expression is associated with a poor prognosis in TNBC.
(A) Frequency plot of CREBBP mutations in breast cancer (from TCGA) stratified on subtype. (B) Oncoprint plot of genomic alterations in CREBBP in a combined analysis of TNBC (n=709) from TCGA, METABRIC and MSKCC cohorts. Frequencies of additional genomic alterations in TNBC are also depicted. (C) CREBBP mRNA expression in TNBCs stratified on CREBBP status in TCGA and METABRIC. (D) Bar chart depicting frequency of CREBBP protein expression in TNBCs from tissue microarrays of the Belgrade and BR10011a cohorts combined (n = 174). Representative micrographs of CREBBP protein expression are shown from Belgrade and corresponding Allred scores. Scale bar represents 100μm. (E) Kaplan-Meier plots for disease specific survival (DSS) in triple negative breast cancers from METABRIC (n=276) and that were stratified on their CREBBP mRNA expression (high, intermediate and low). Multivariable survival analysis was performed by taking into account CREBBP mRNA expression status, age, tumour size, node status and grade. (F) Kaplan-Meier plots for distant metastasis-free survival (DMFS) in triple negative breast cancers that were stratified on their CREBBP protein expression (high and low) from the Belgrade cohort that had associated outcome data. Low CREBBP expression was defined as Allred score <4. Multivariable survival analysis was performed by taking into account CREBBP protein expression status, age, TNM stage and grade. (G) Kaplan-Meier plots for distant metastasis-free survival (DMFS) in triple negative breast cancers that were stratified on their CREBBP mRNA expression (high and low) from the Belgrade cohort that had associated outcome data. Multivariable survival analysis was performed by taking into account CREBBP mRNA expression status, age, TNM stage and grade. (H) Box plots of the diversity of gene, isoform and exon expression in CREBBP WT and CREBBPaltered TNBCs. Diversity index was calculated using Shannon’s equitability index. (I) Box plots of the mutational burden in CREBBP WT and CREBBPaltered TNBCs.

