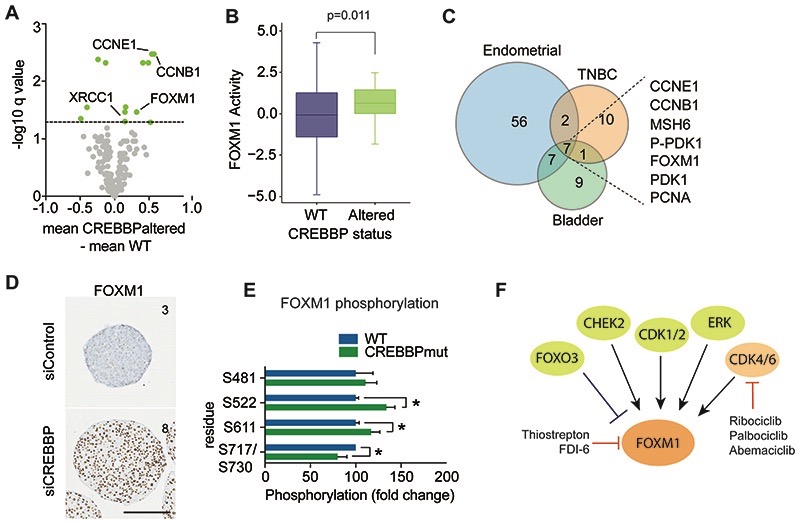
Figure 4. CREBBPaltered cancers show increased FOXM1 driven proliferation.
(A) Volcano plot of fold change in protein expression (x-axis) from reverse phase protein RPPA data of TNBCs stratified on CREBBP status, plotted against –log10P value (y-axis). Significant alterations in protein expression are highlighted in orange (FDR corrected p values <0.1). (B) Box plot of FOXM1 gene activity in CREBBPaltered TNBC. mRNA expression from TCGA was used to calculate FOXM1 activity utilizing a rank-based enrichment analysis (see Supplementary methods). (C) Venn diagram of significantly altered proteins between CREBBP-altered and WT tumours from RPPA data of TNBCs, endometrial and bladder cancers. (D) Representative micrographs of FOXM1 protein expression from 7-day spheroids of MCF10DCIS.com after siRNA silencing of CREBBP or non-targeting control. Text depicts IHC quantification (Allred scores). (Scale bar represents 200μm). (E) Bar plot of fold change in phosphorylated protein expression (x-axis) from mass spectrometry assessment of day 4 spheroids of HAP1 WT and CREBBPmut spheroids, plotted against –log10P value (y-axis). (F) A diagram of FOXM1 and the proteins that regulate its activity. Direct and indirect inhibitors are highlighted.

