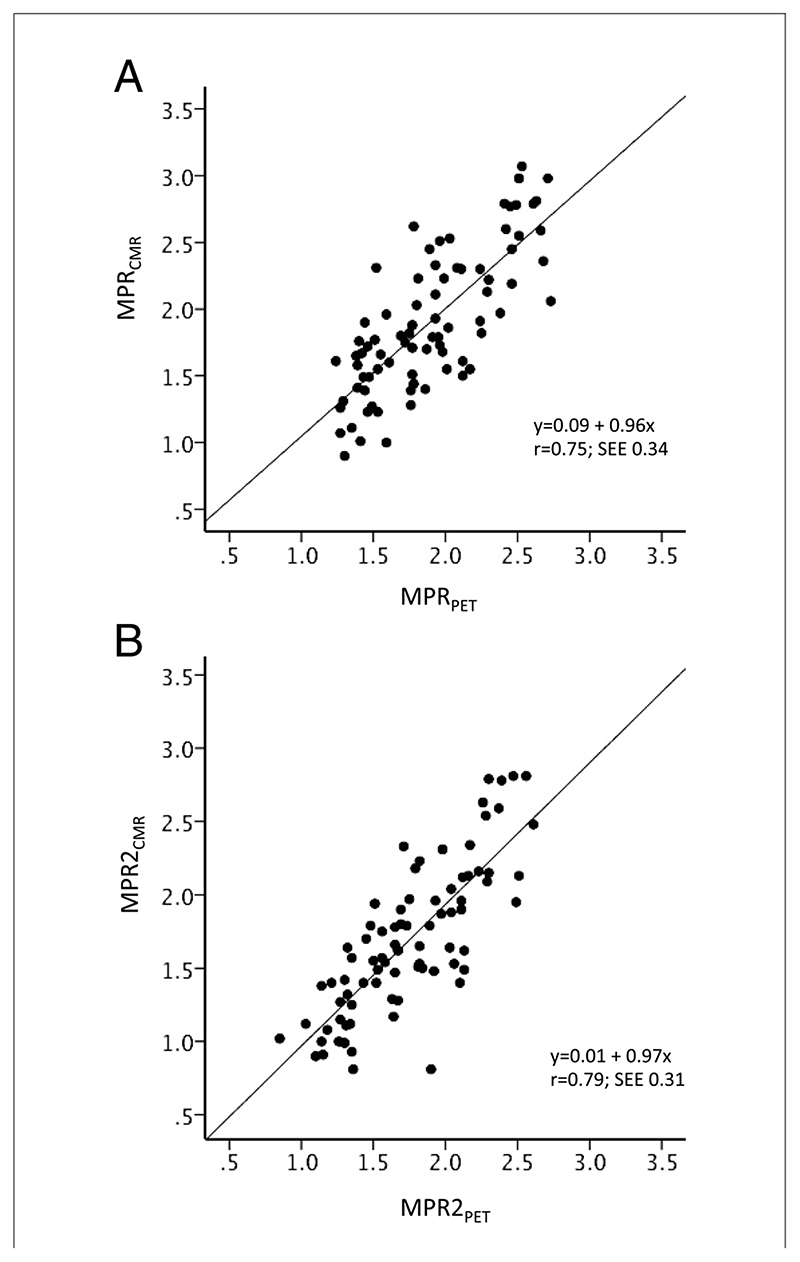
Figure 1. Scatter Plots Comparing CMR- and PET-Derived MPR.
Scatter plots with fit lines comparing myocardial perfusion reserve (MPR) values from cardiac magnetic resonance (MPRCMR) and positron emission tomography (MPRPET) for the entire myocardial territory (A) and the mean of the lowest 2 segments in each territory (MPR2) (B).

