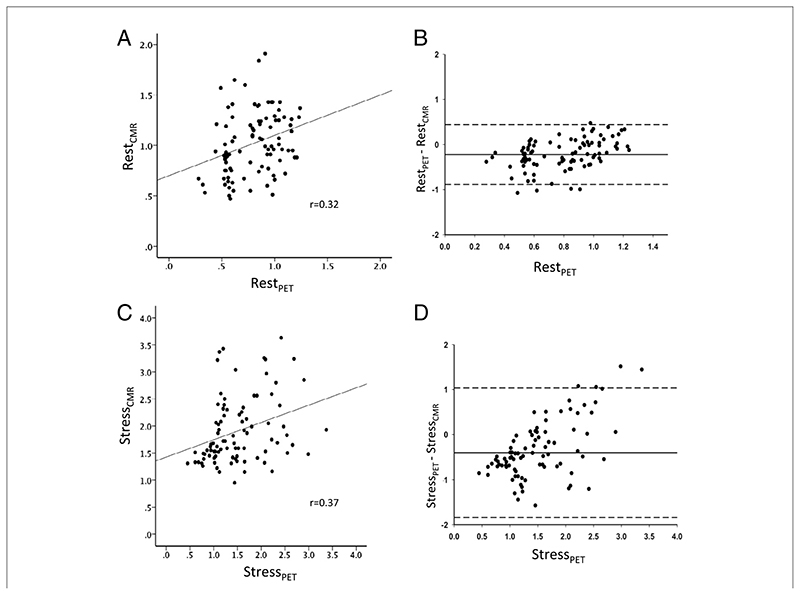
Figure 3. I Correlation and Agreement Between CMR- and PET-Derived Absolute Perfusion Values.
Scatter plots illustrating the correlation between absolute measures of myocardial perfusion at rest (A) and during peak stress (C), along with the corresponding Bland-Altman plots (B and D, respectively) with limits of agreement lines (2 SDs). CMR = cardiac magnetic resonance; PET = positron emission tomography.

