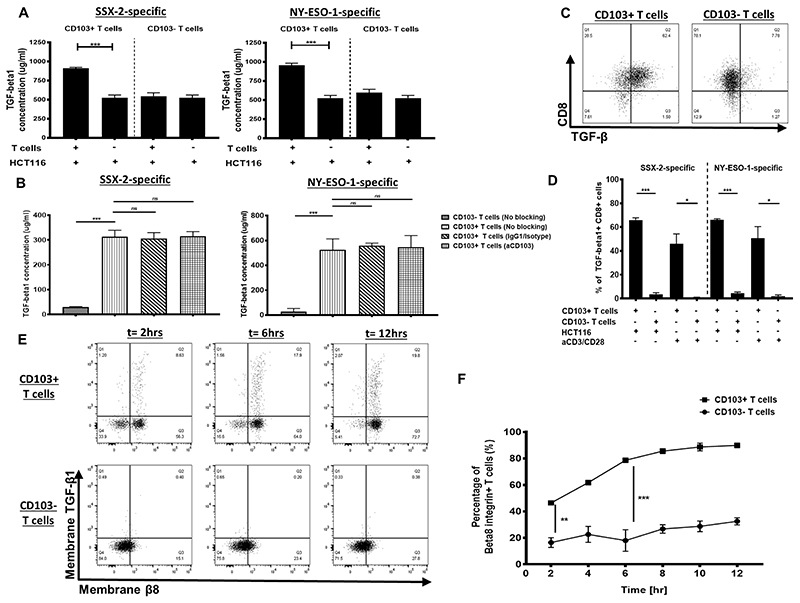
Figure 1. TGFβ1 self-dependency of CD103+ cancer-specific T cells.
(A) TGFβ1 production by either CD103+ or CD103− T cells following coculture with HCT116 cells and 1μM antigen or HCT116 cells alone (N, number of repeats=3). (B) TGFβ1 production by either CD103+ or CD103− T cells following coculture with HCT116 cells with either no treatment, isotype treatment, or anti-CD103 treatment. SSX-2–specific T-cell clones (left) and NY-ESO-1-specific T-cell clones (right)(N, number of repeats=3). (C) Representative flow cytometry dot plots of TGFβ1-expressing CD103+ or CD103−CD8+ cells specific for SSX-2following coculture with HCT116 and 1μM antigen (N, number of repeats=3). (D) Proportion of TGFβ1+ CD103+ or CD103− T cells following coculture with HCT116 cell and1μM antigen or anti-CD3/CD28 (N, number of repeats=3). (E) Flow cytometry plots of membranous TGFβ1 and membranous β8 expression on either CD103+ or CD103− T cells, at 2, 6, and 12 hours post coculture with 1 μM SSX-2 antigen-stimulated HCT116 cells (N, number of repeats=3). (F) Frequency of β8+CD103+ or CD103− T cells post coculture with 1 μM SSX-2 antigen-stimulated HCT116 cells across 12 hours (N, number of repeats n=3). Data presented as median±S.E.M. *p-value<0.05; **p-values<0.01; ***p-values<0.001; ns, not significant. P-values were calculated using either one-way ANOVA with Tukey post hoc analysis or paired student t-test with Wilcoxon adjustments.

